10. Data Statistics analysis
10.1 Dashboard
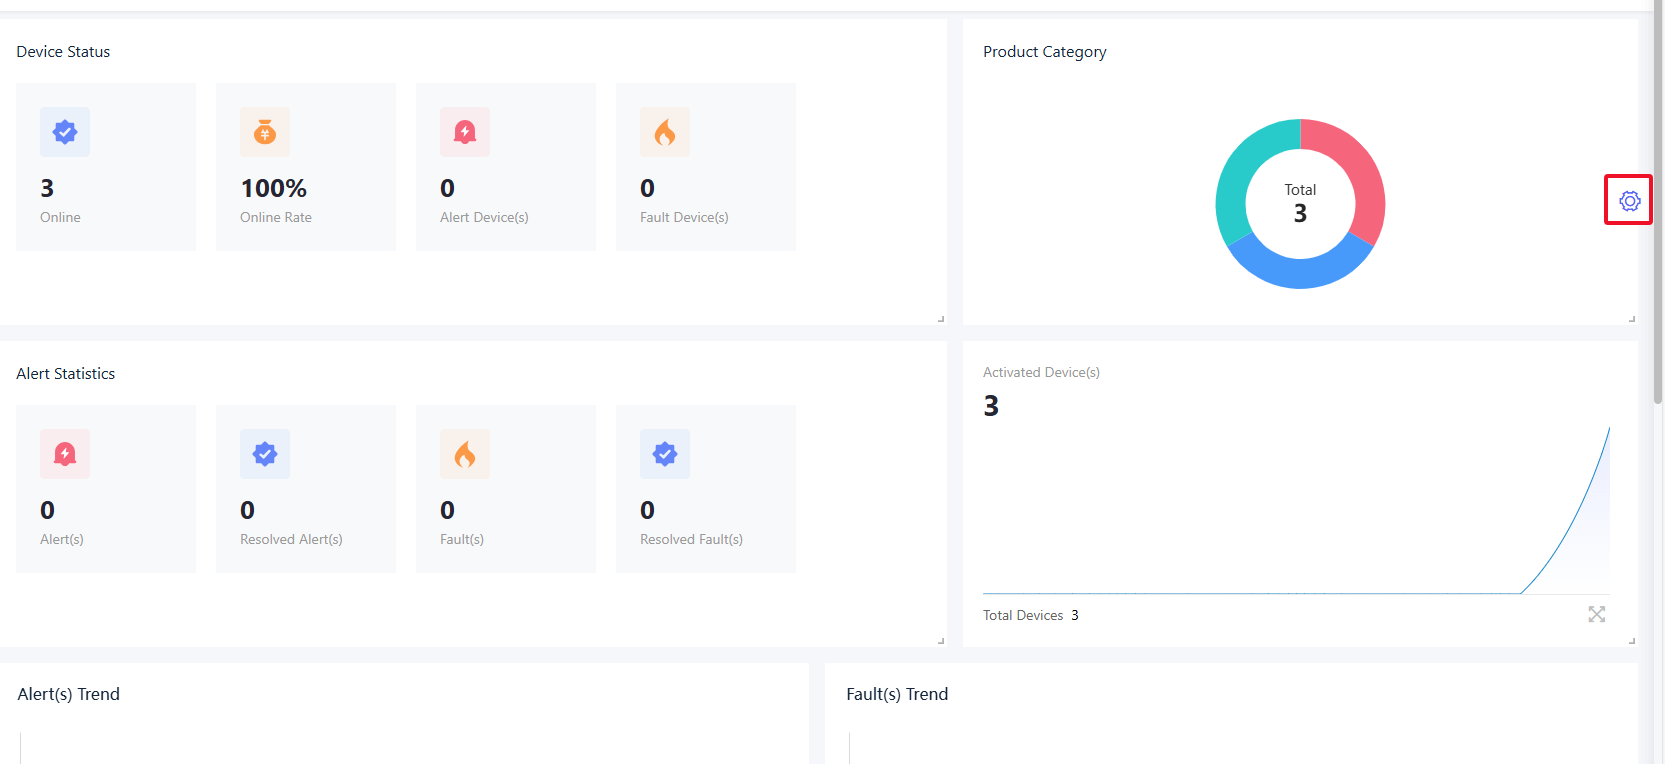
The data dashboard provides statistical data information such as products, devices, fault alerts for the AMP's homepage and dashboard.
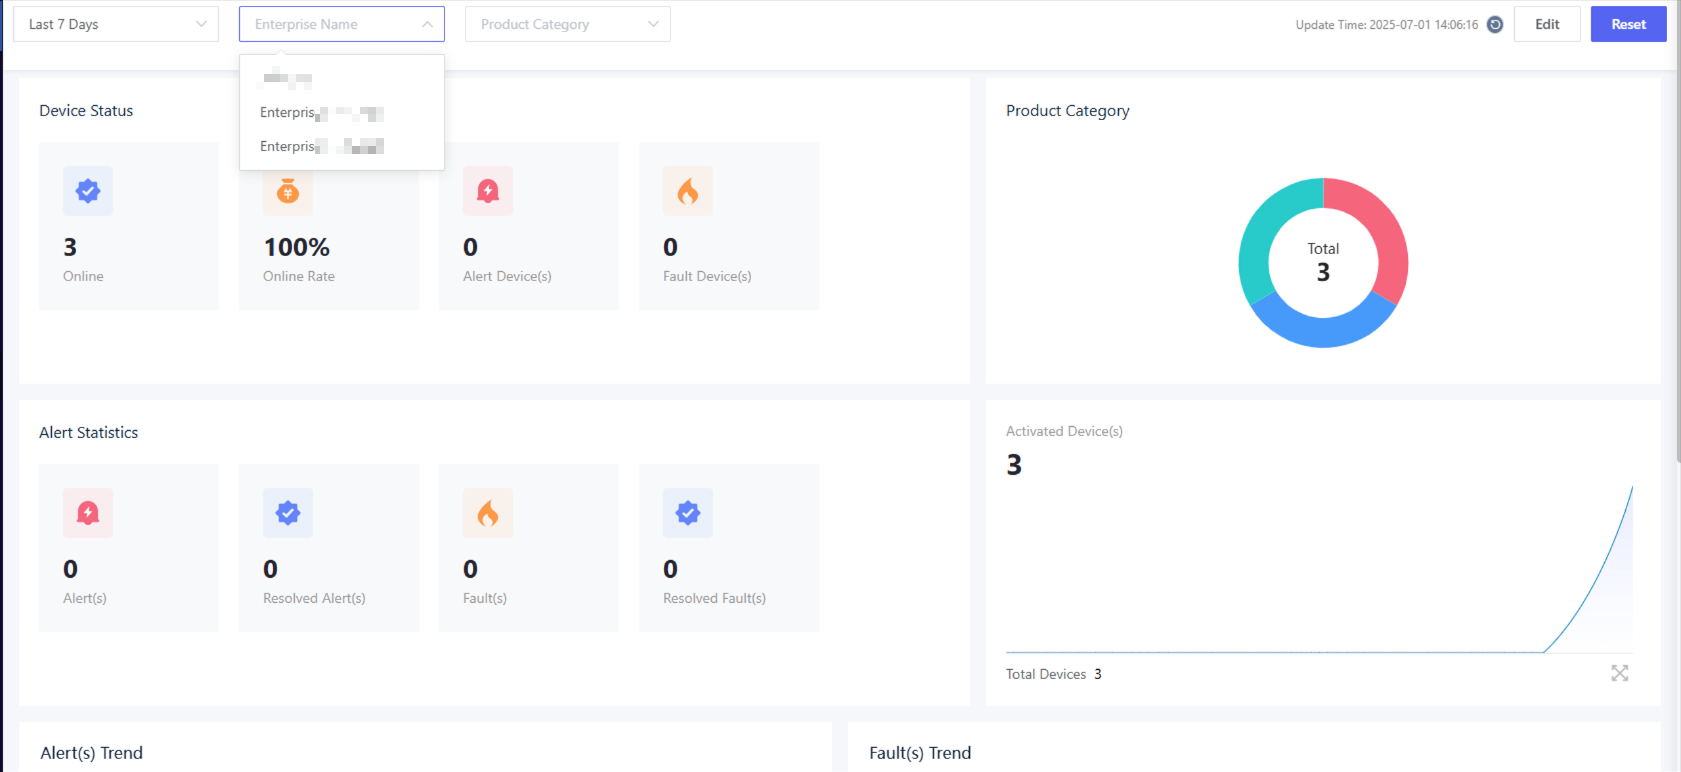
The data dashboard displays a summary of device data by default for the current level and all subordinate levels. Click the “Enterprise Name” option and select an enterprise, you can view the device data for the selected enterprise.
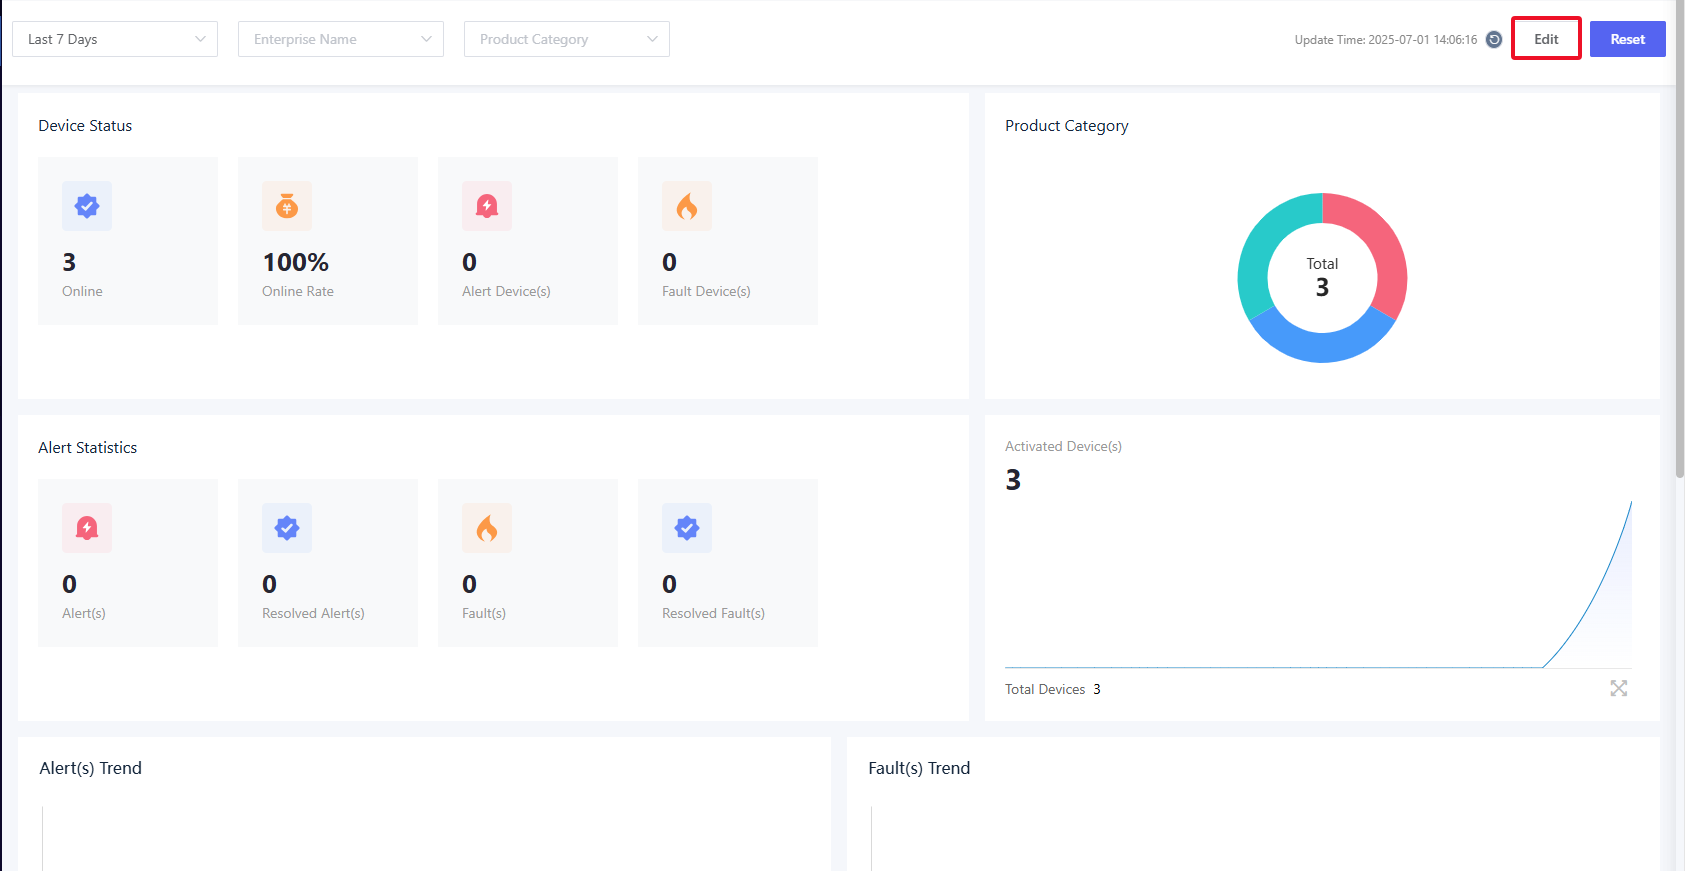
After logging in to the AMP, you will see the default configured data dashboard. Click "Edit” and you can customize the dashboard.
Click the icon at the bottom right of the chart, and then you can drag and adjust the layout of various indicators in the dashboard.
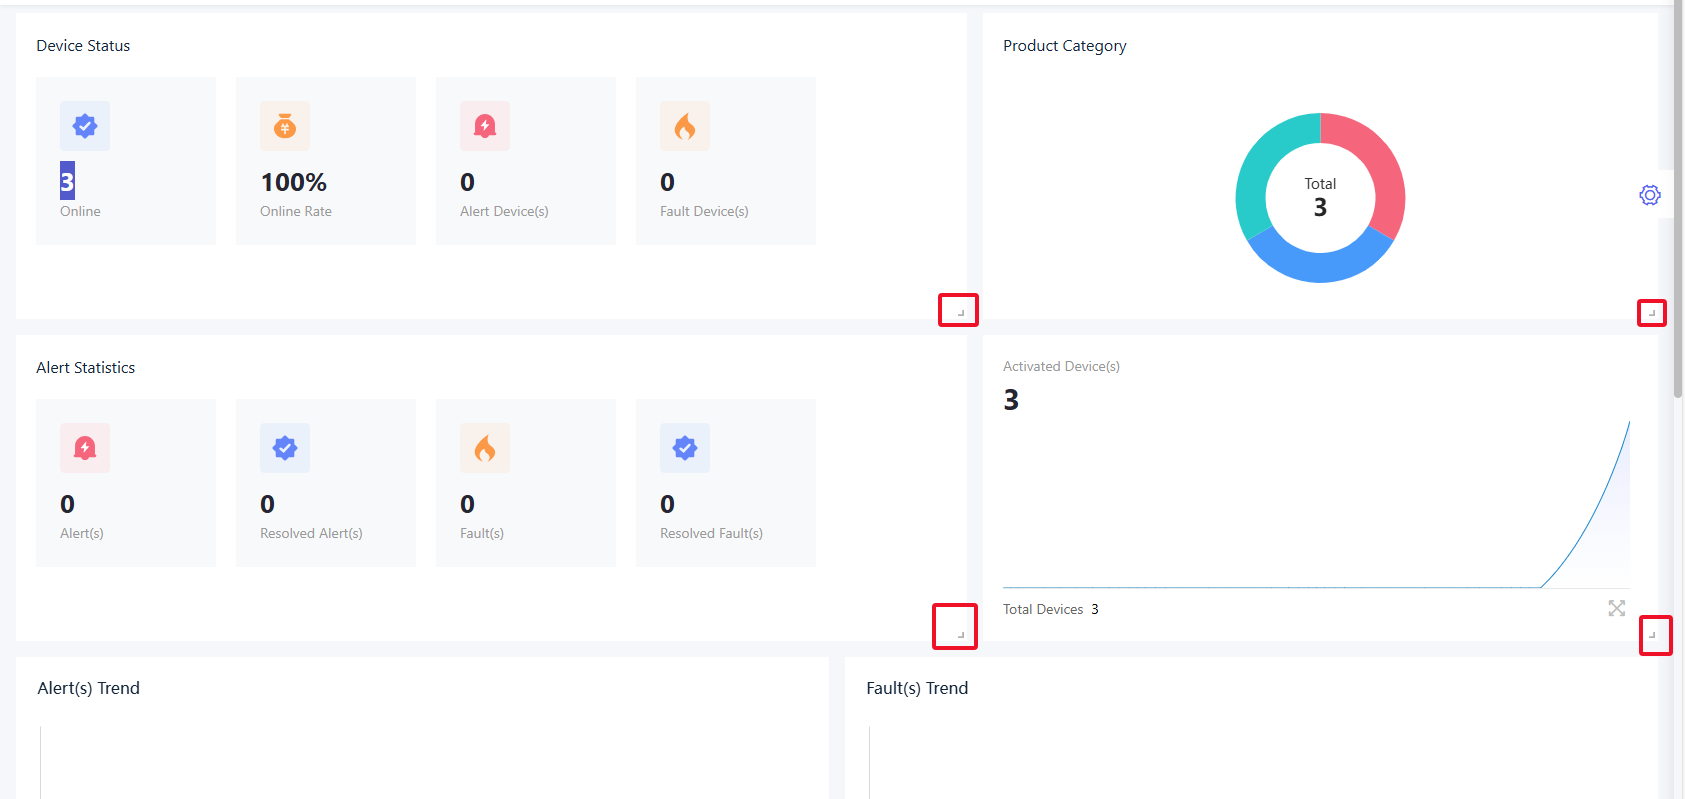
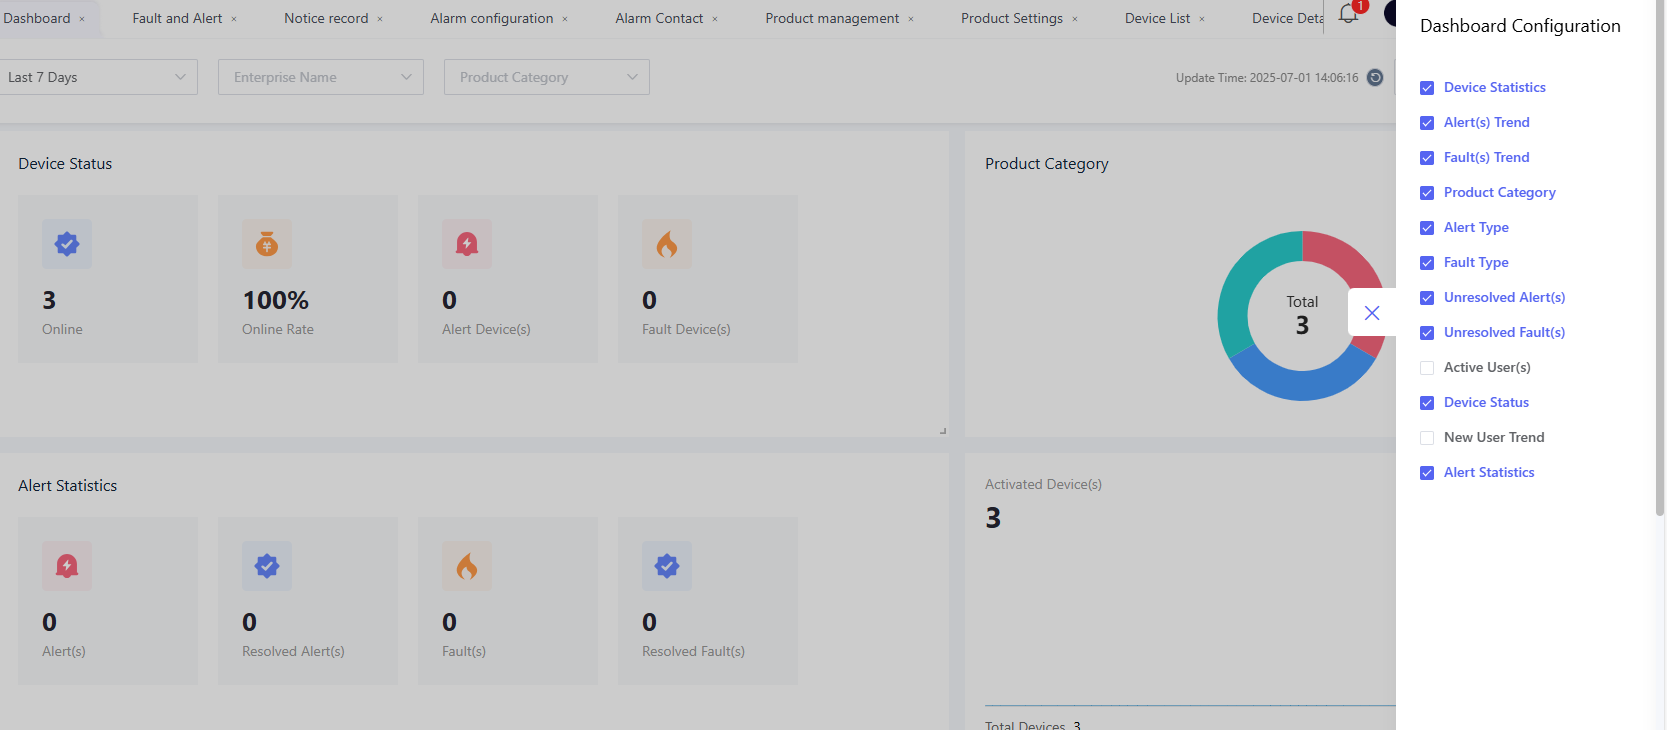
Click "Dashboard Configuration” and you can select which indicator to add or remove. Some indicators may require configuring specific TSL models to take effect.
The following charts require that devices have corresponding TSL codes and that the product data aggregation configuration be completed for statistical display.
- Electricity Usage Statistics: It includes cards for today's electricity usage, this week's electricity usage, this month's electricity usage, and this year's electricity usage. The TSL code for electricity usage should be LedTotalEnergy.
- Lighting Rate: The TSL model code for the lighting status should be PowerSwitch.
- Top 5 Electricity Consumption: The TSL model code for electricity consumption should be DeviceEpt.
Then navigate to the “Product” - “Data Aggregation” page to add the above attributes for aggregation statistics. For specific operations, please refer to Data Aggregation Configuration.
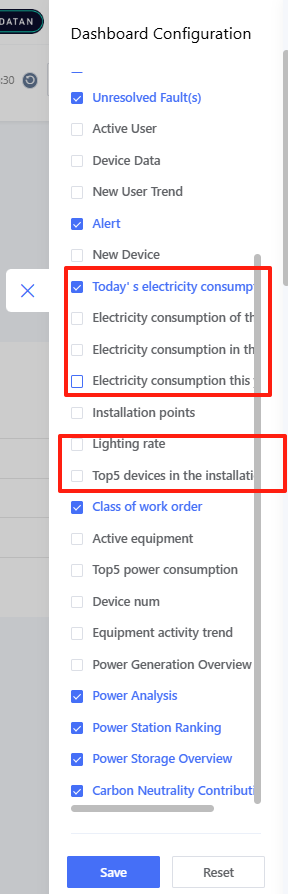
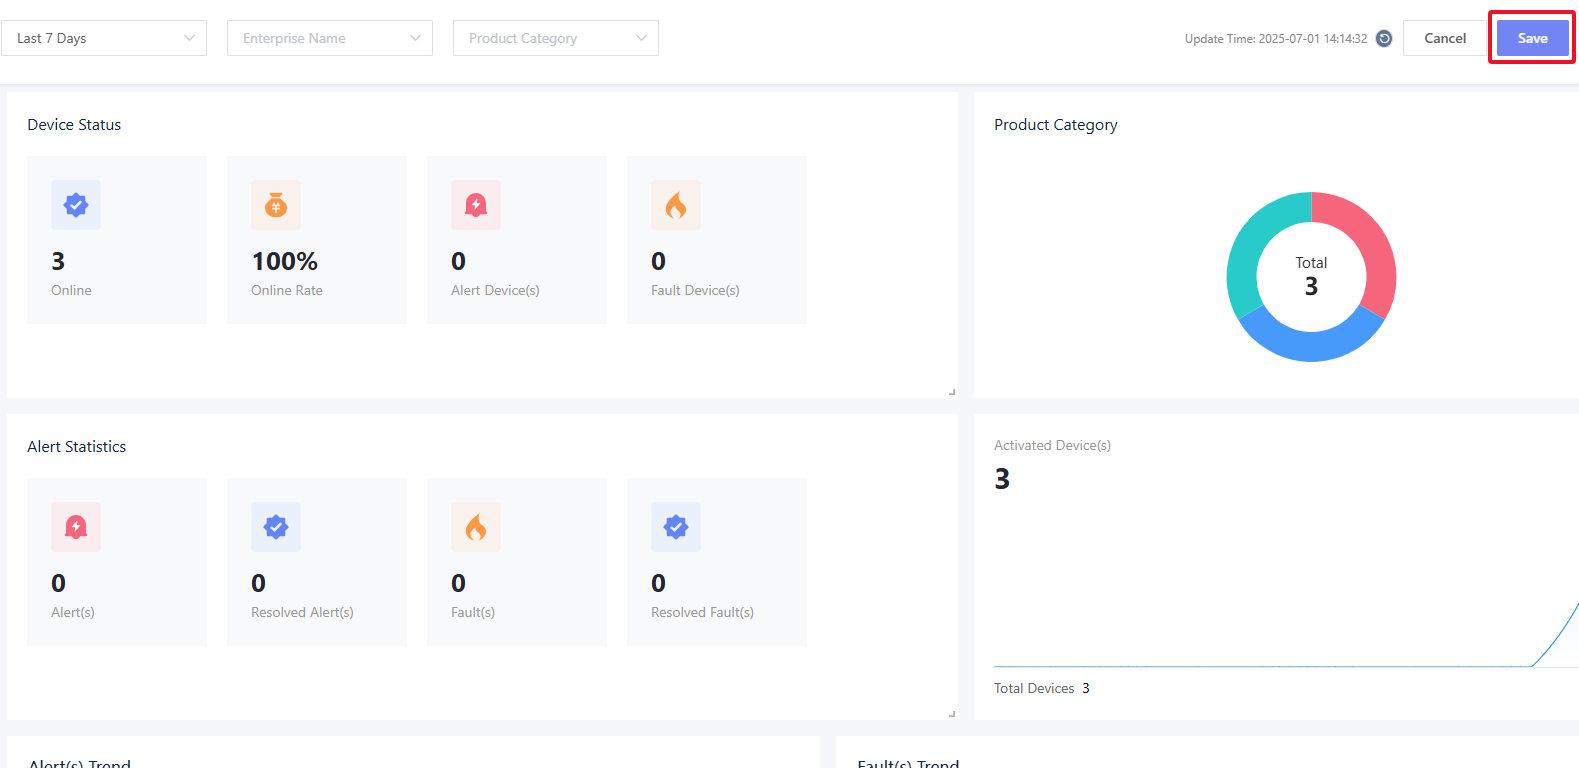
After making adjustments, click "Save" to apply the changes to the entire data dashboard