5.3 Manage Installation Site
5.3.1 Overview of Device Data at the Installation Site
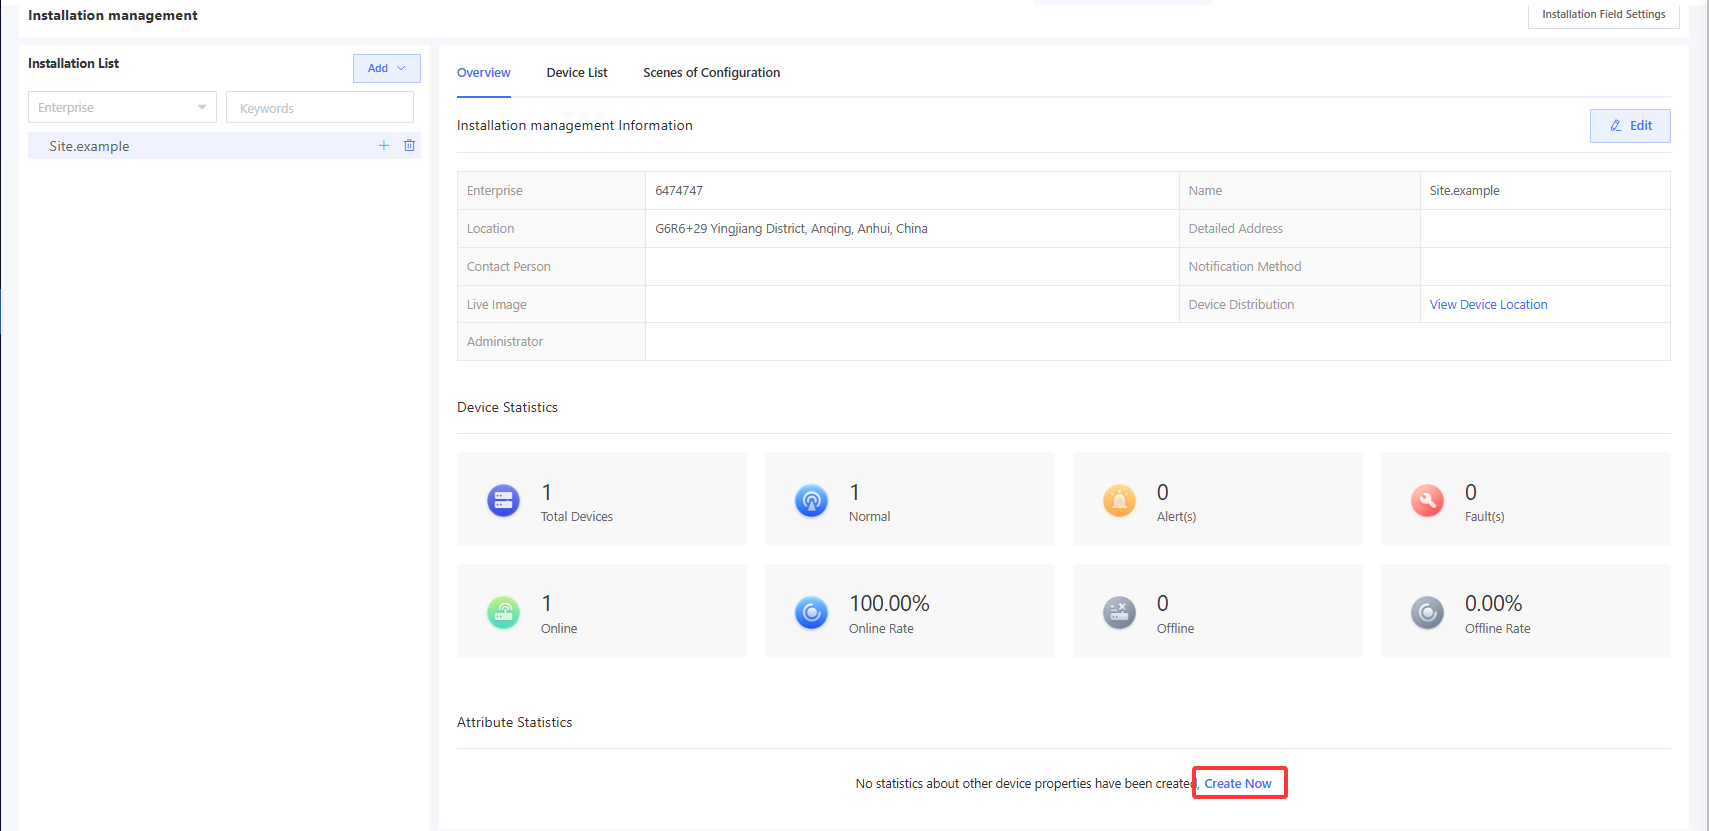
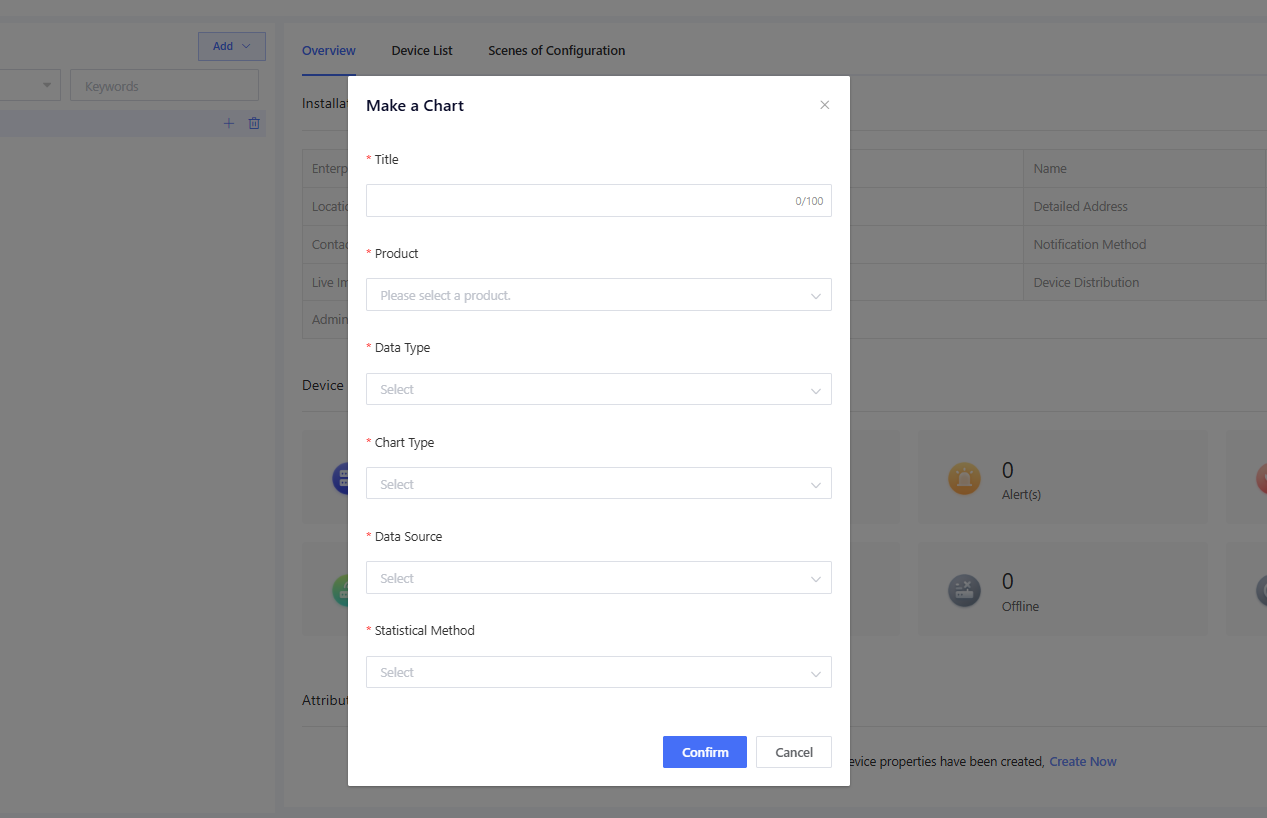
On the “Overview” page, you can get a summary of device statistics at the installation site. You can also customize statistical charts based on property data at the installation site. The method for adding custom charts is similar to the Running Records configuration.
5.3.2 Control Devices at the Installation Site in Batches
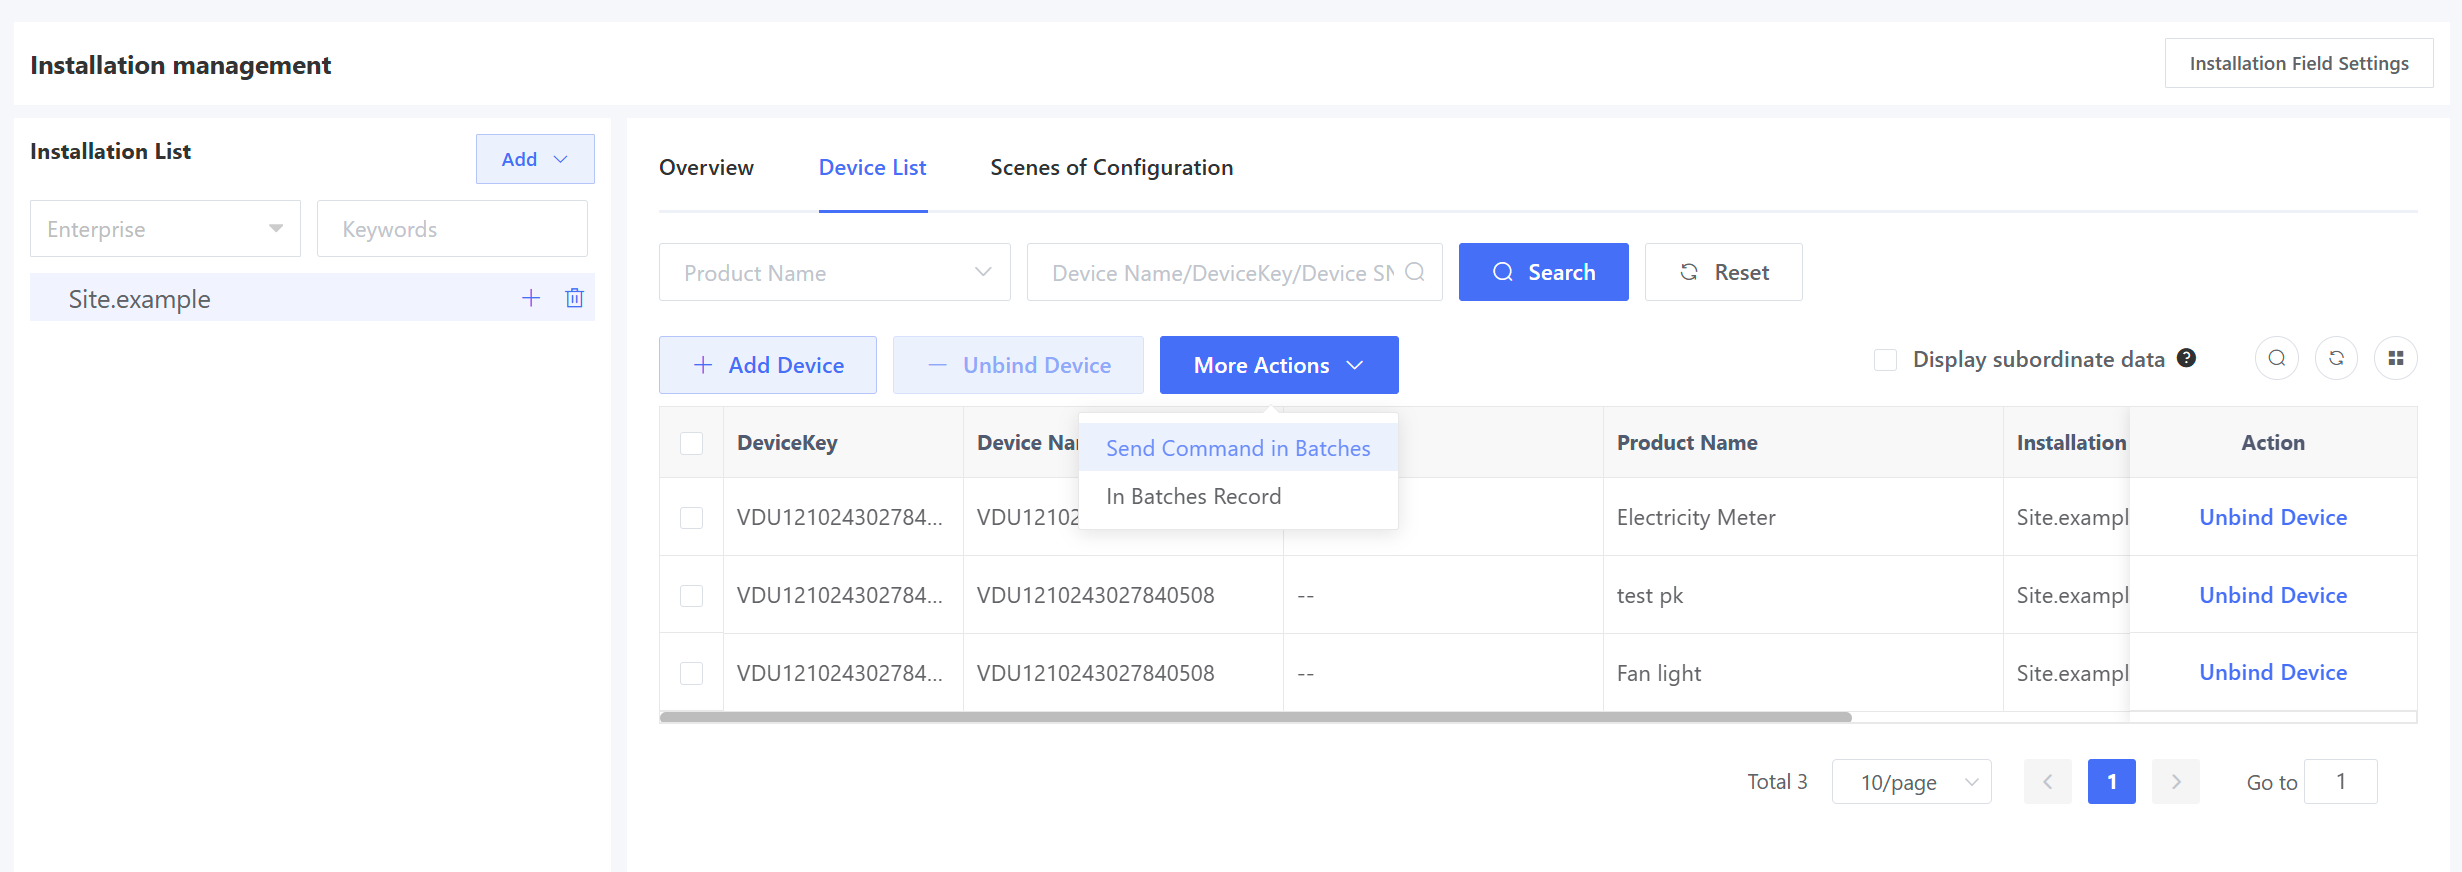
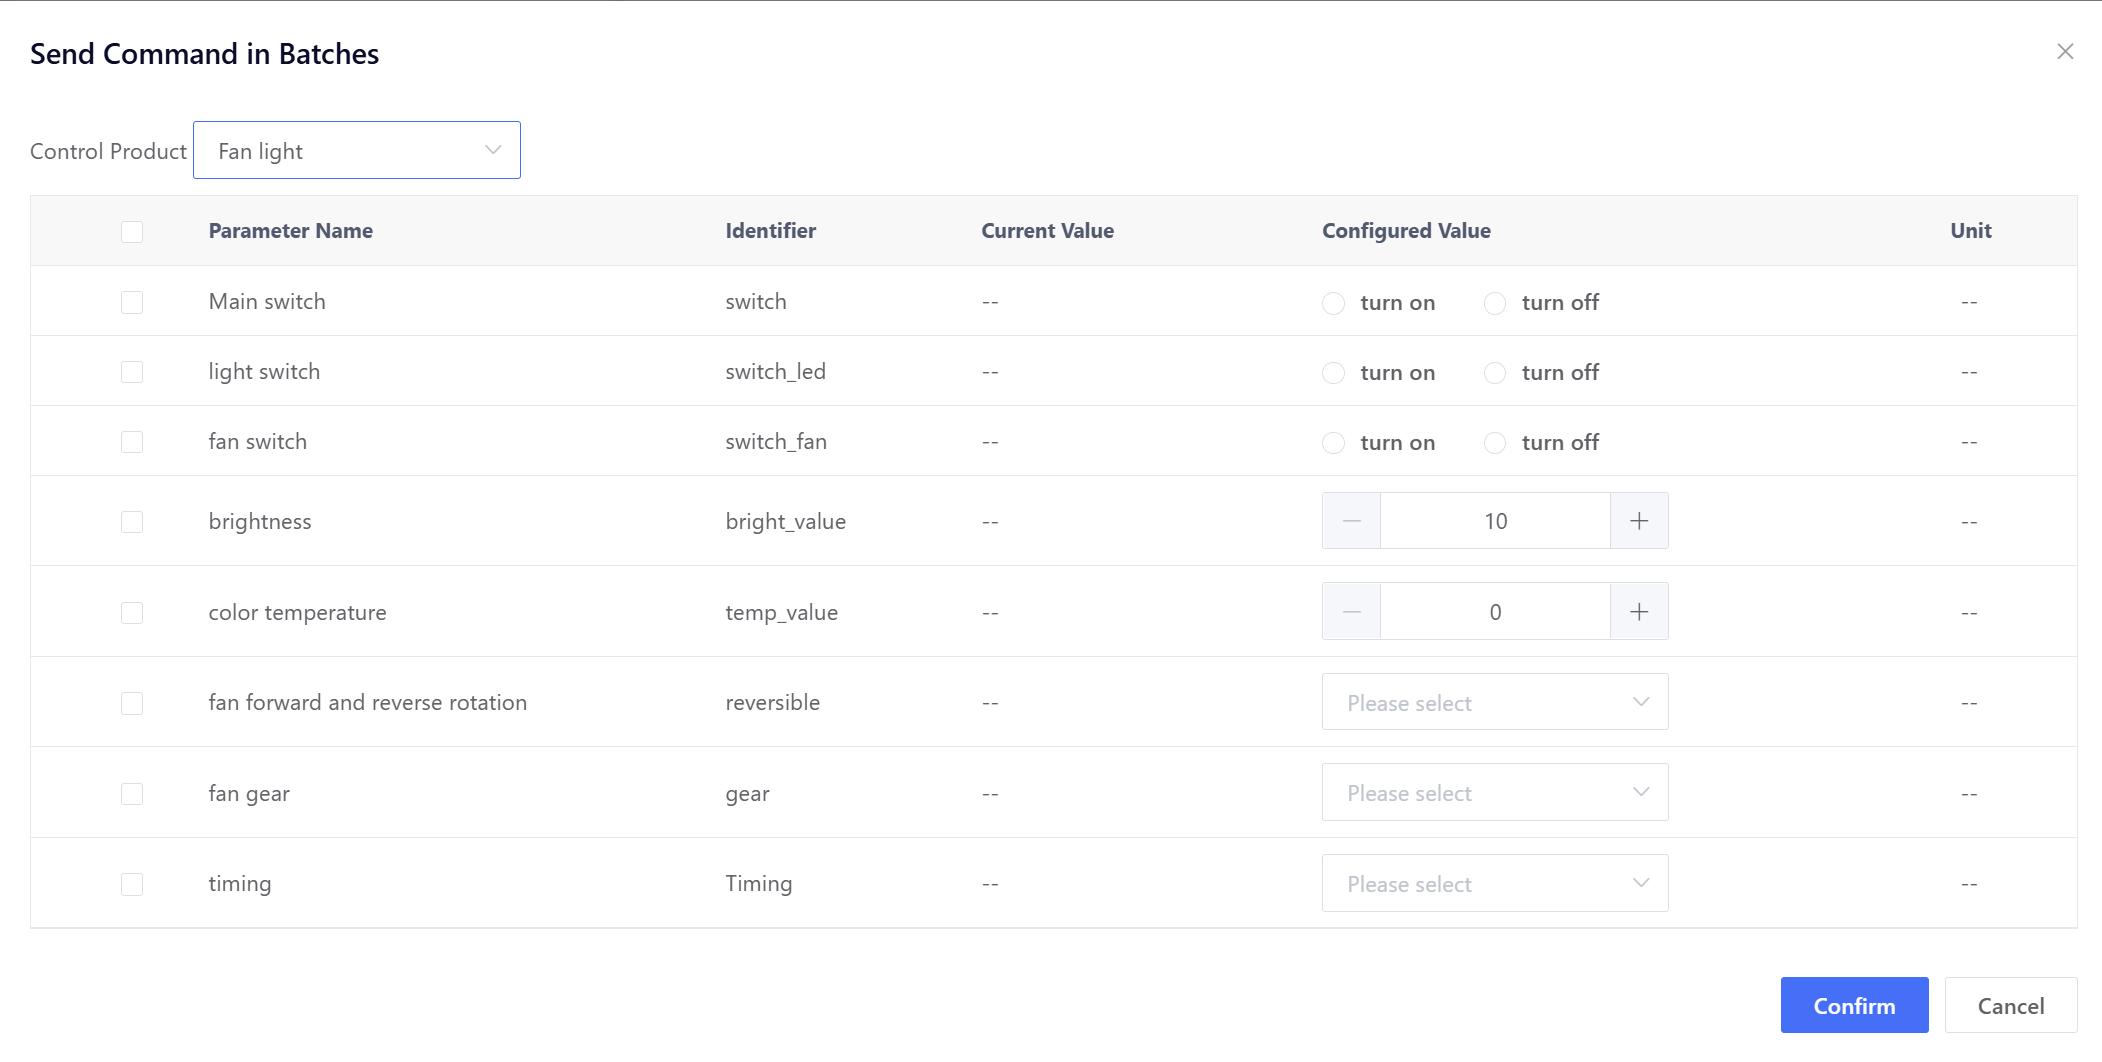
Click “Send Commands in Batches” and select the product in the pop-up to perform batch control operations (e.g., switch) on all devices of the product at the installation site.
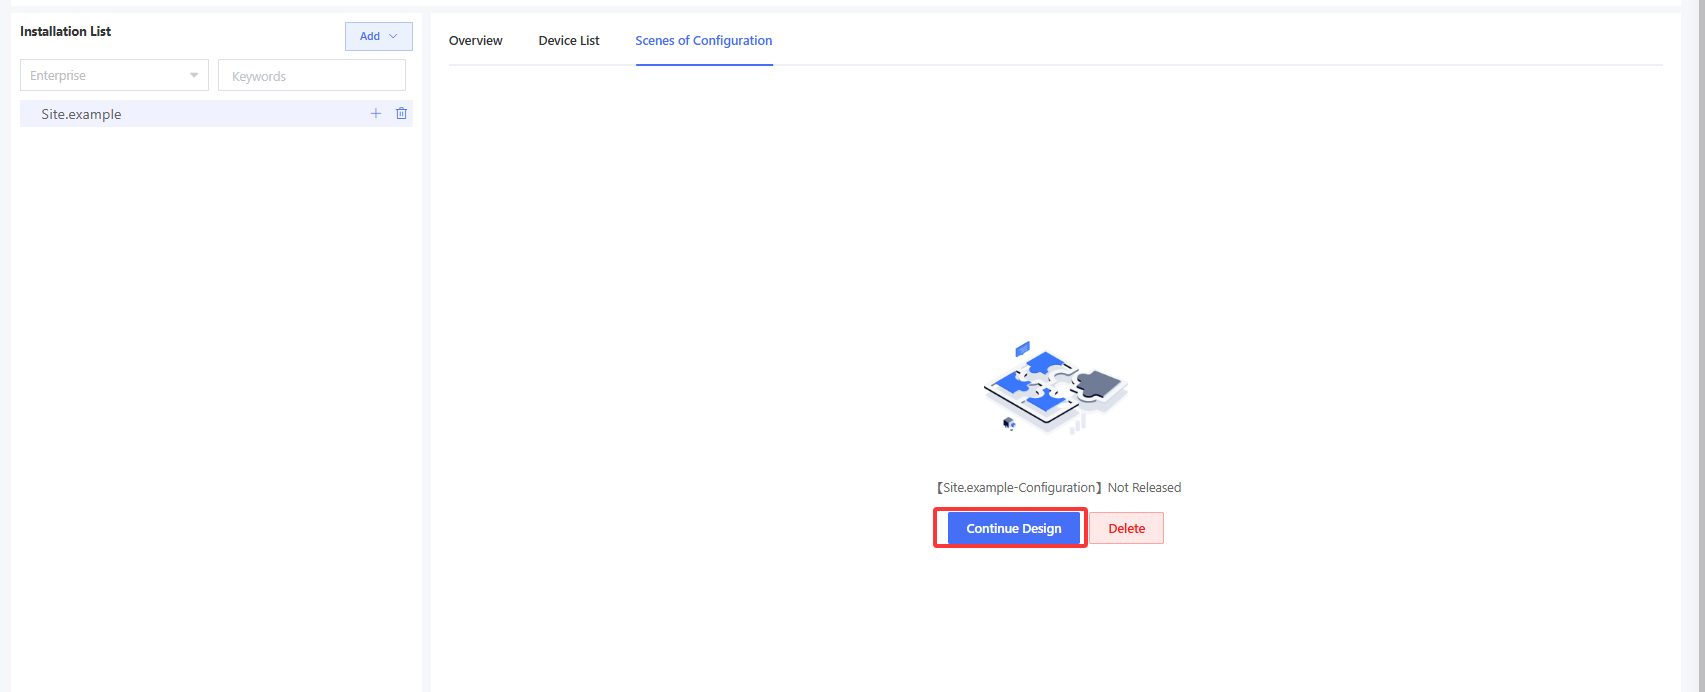
5.3.3 Configure Scene Configuration
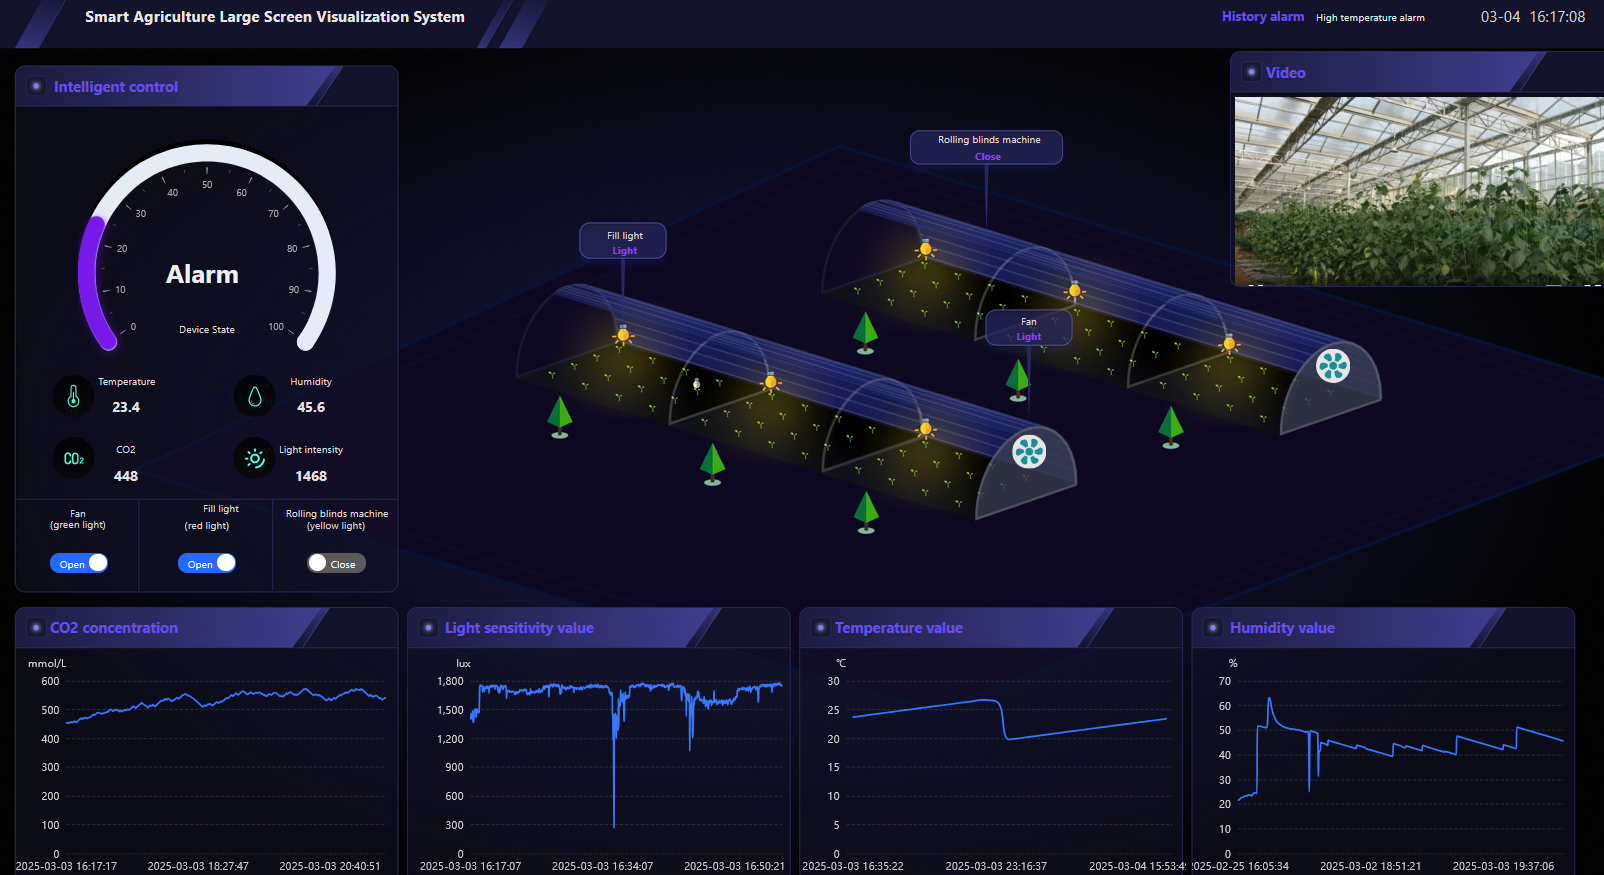
Configuration is a visual function module provided by the platform where users can drag-and-drop elements to draw specific device information. For example, users can arrange device layouts according to actual installation site locations, enabling comprehensive monitoring and remote control of all devices at an installation site through a single interface.
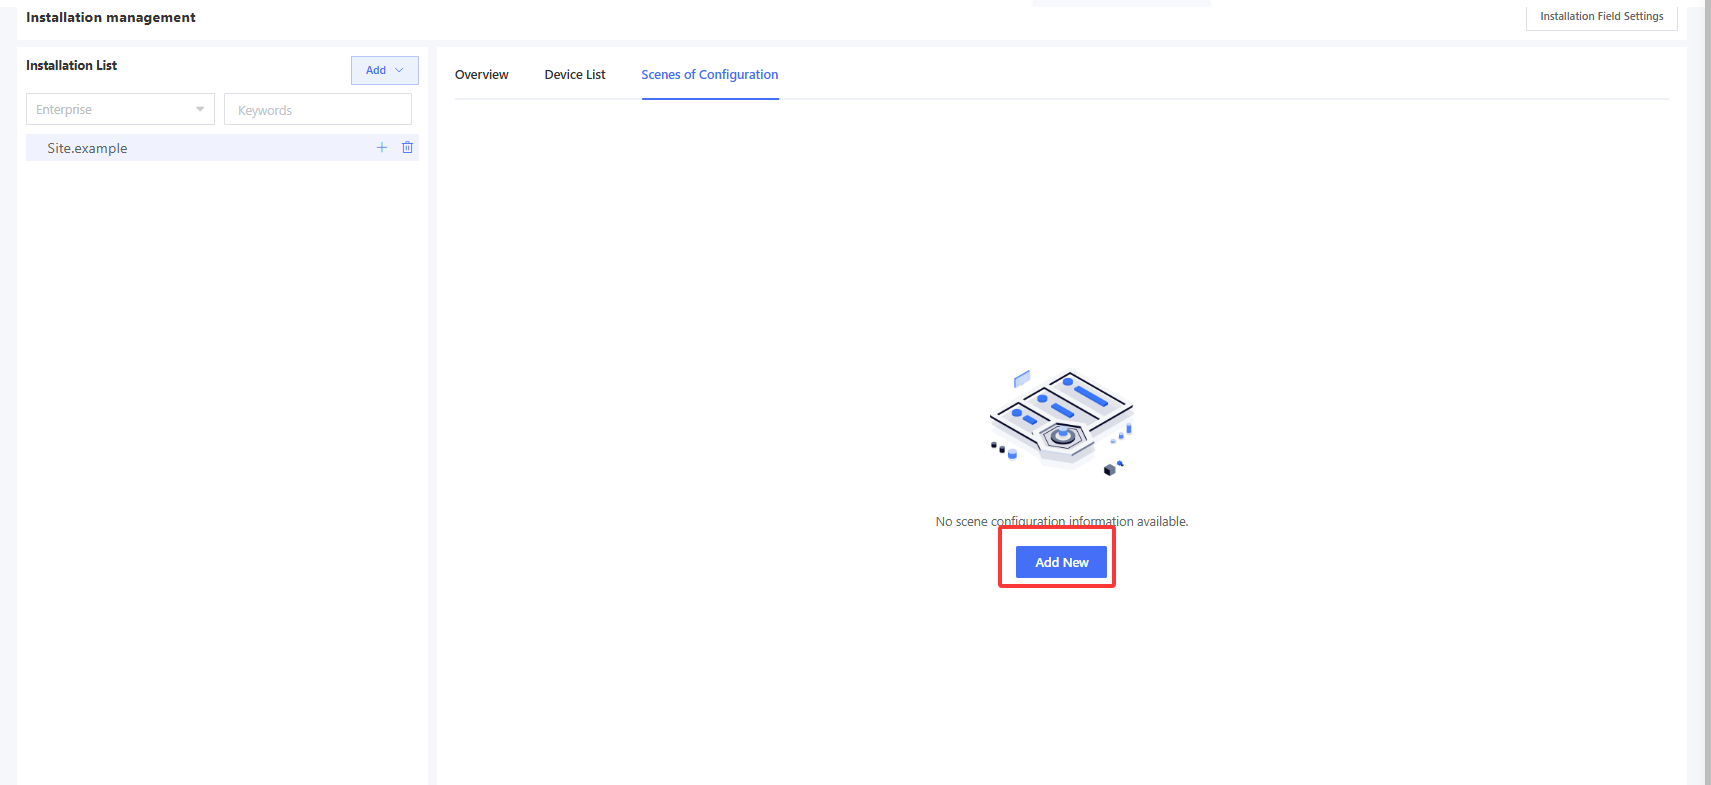
Click “Add New” on the “Scenes of Configuration” page, input a configuration name to enter the configuration design page. You can use configurable elements to draw the device distribution information at an installation site as needed.

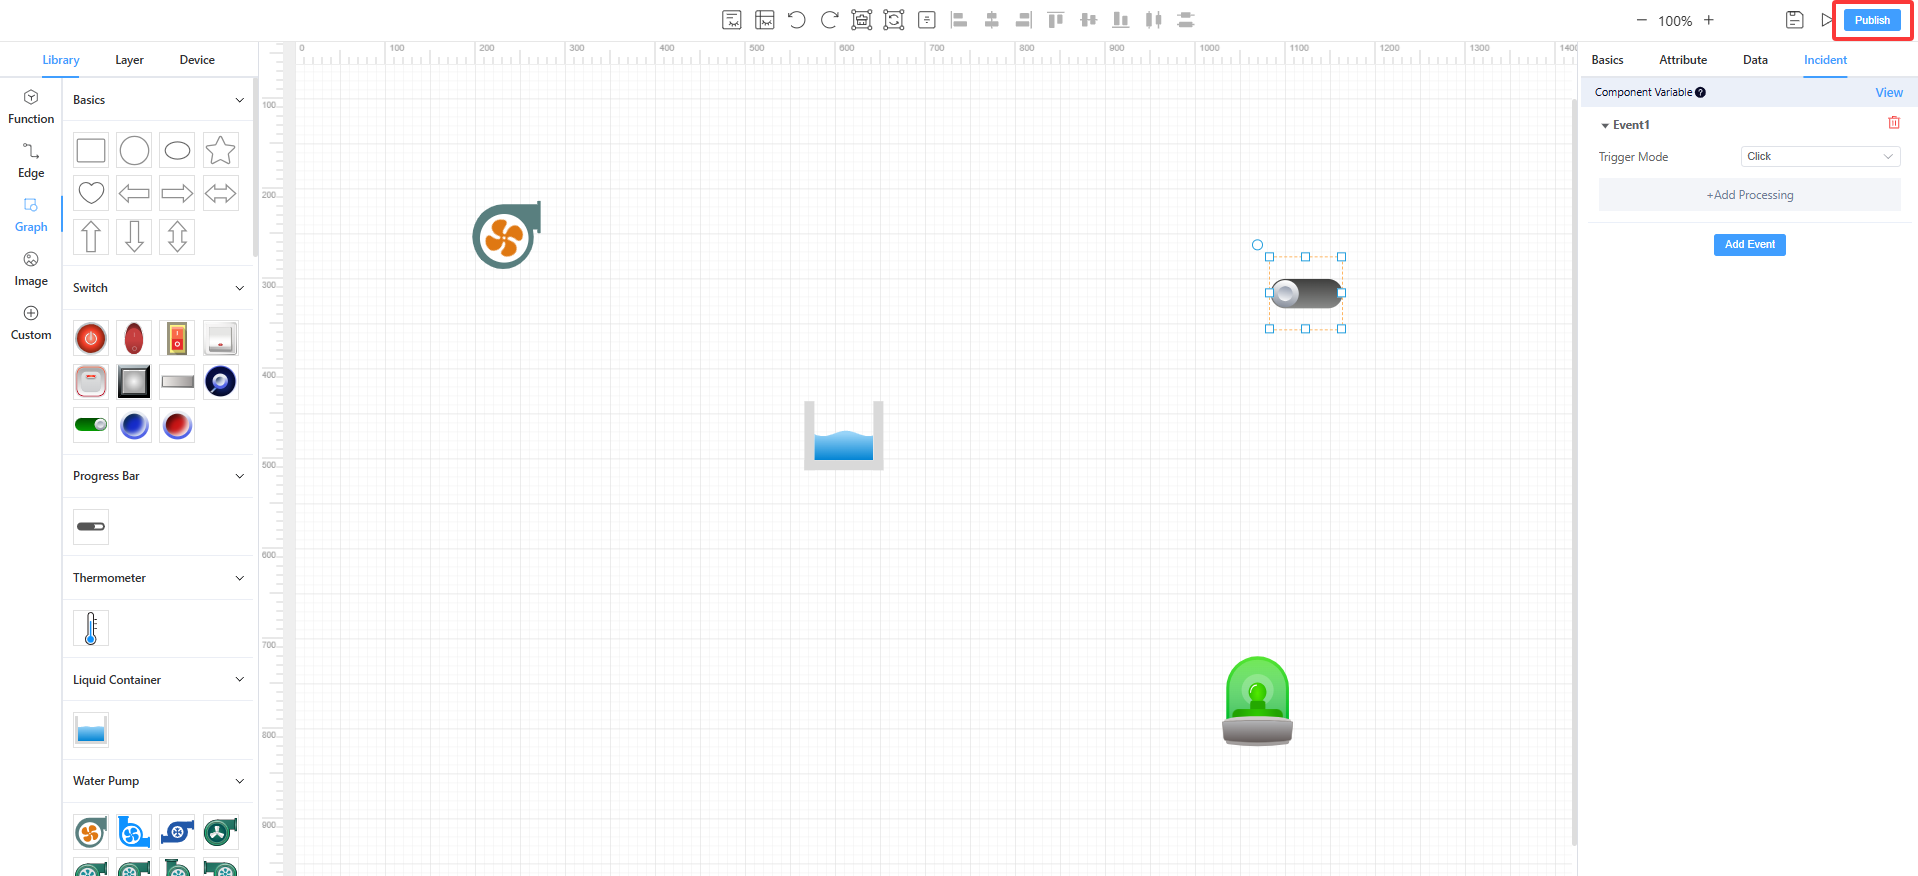
The canvas layout is divided into three sections: left, center, and right. The left section displays the selectable configuration elements; the center section is the main area for drawing and arranging components; and the right section displays detailed configuration options for the selected component. Workflow for configuration:
Step 1: Determine what content needs to be displayed for the installation site, and drag the corresponding elements from the left panel onto the canvas. Step 2: Click on an element in the canvas to select it, and configure its details in the right panel.
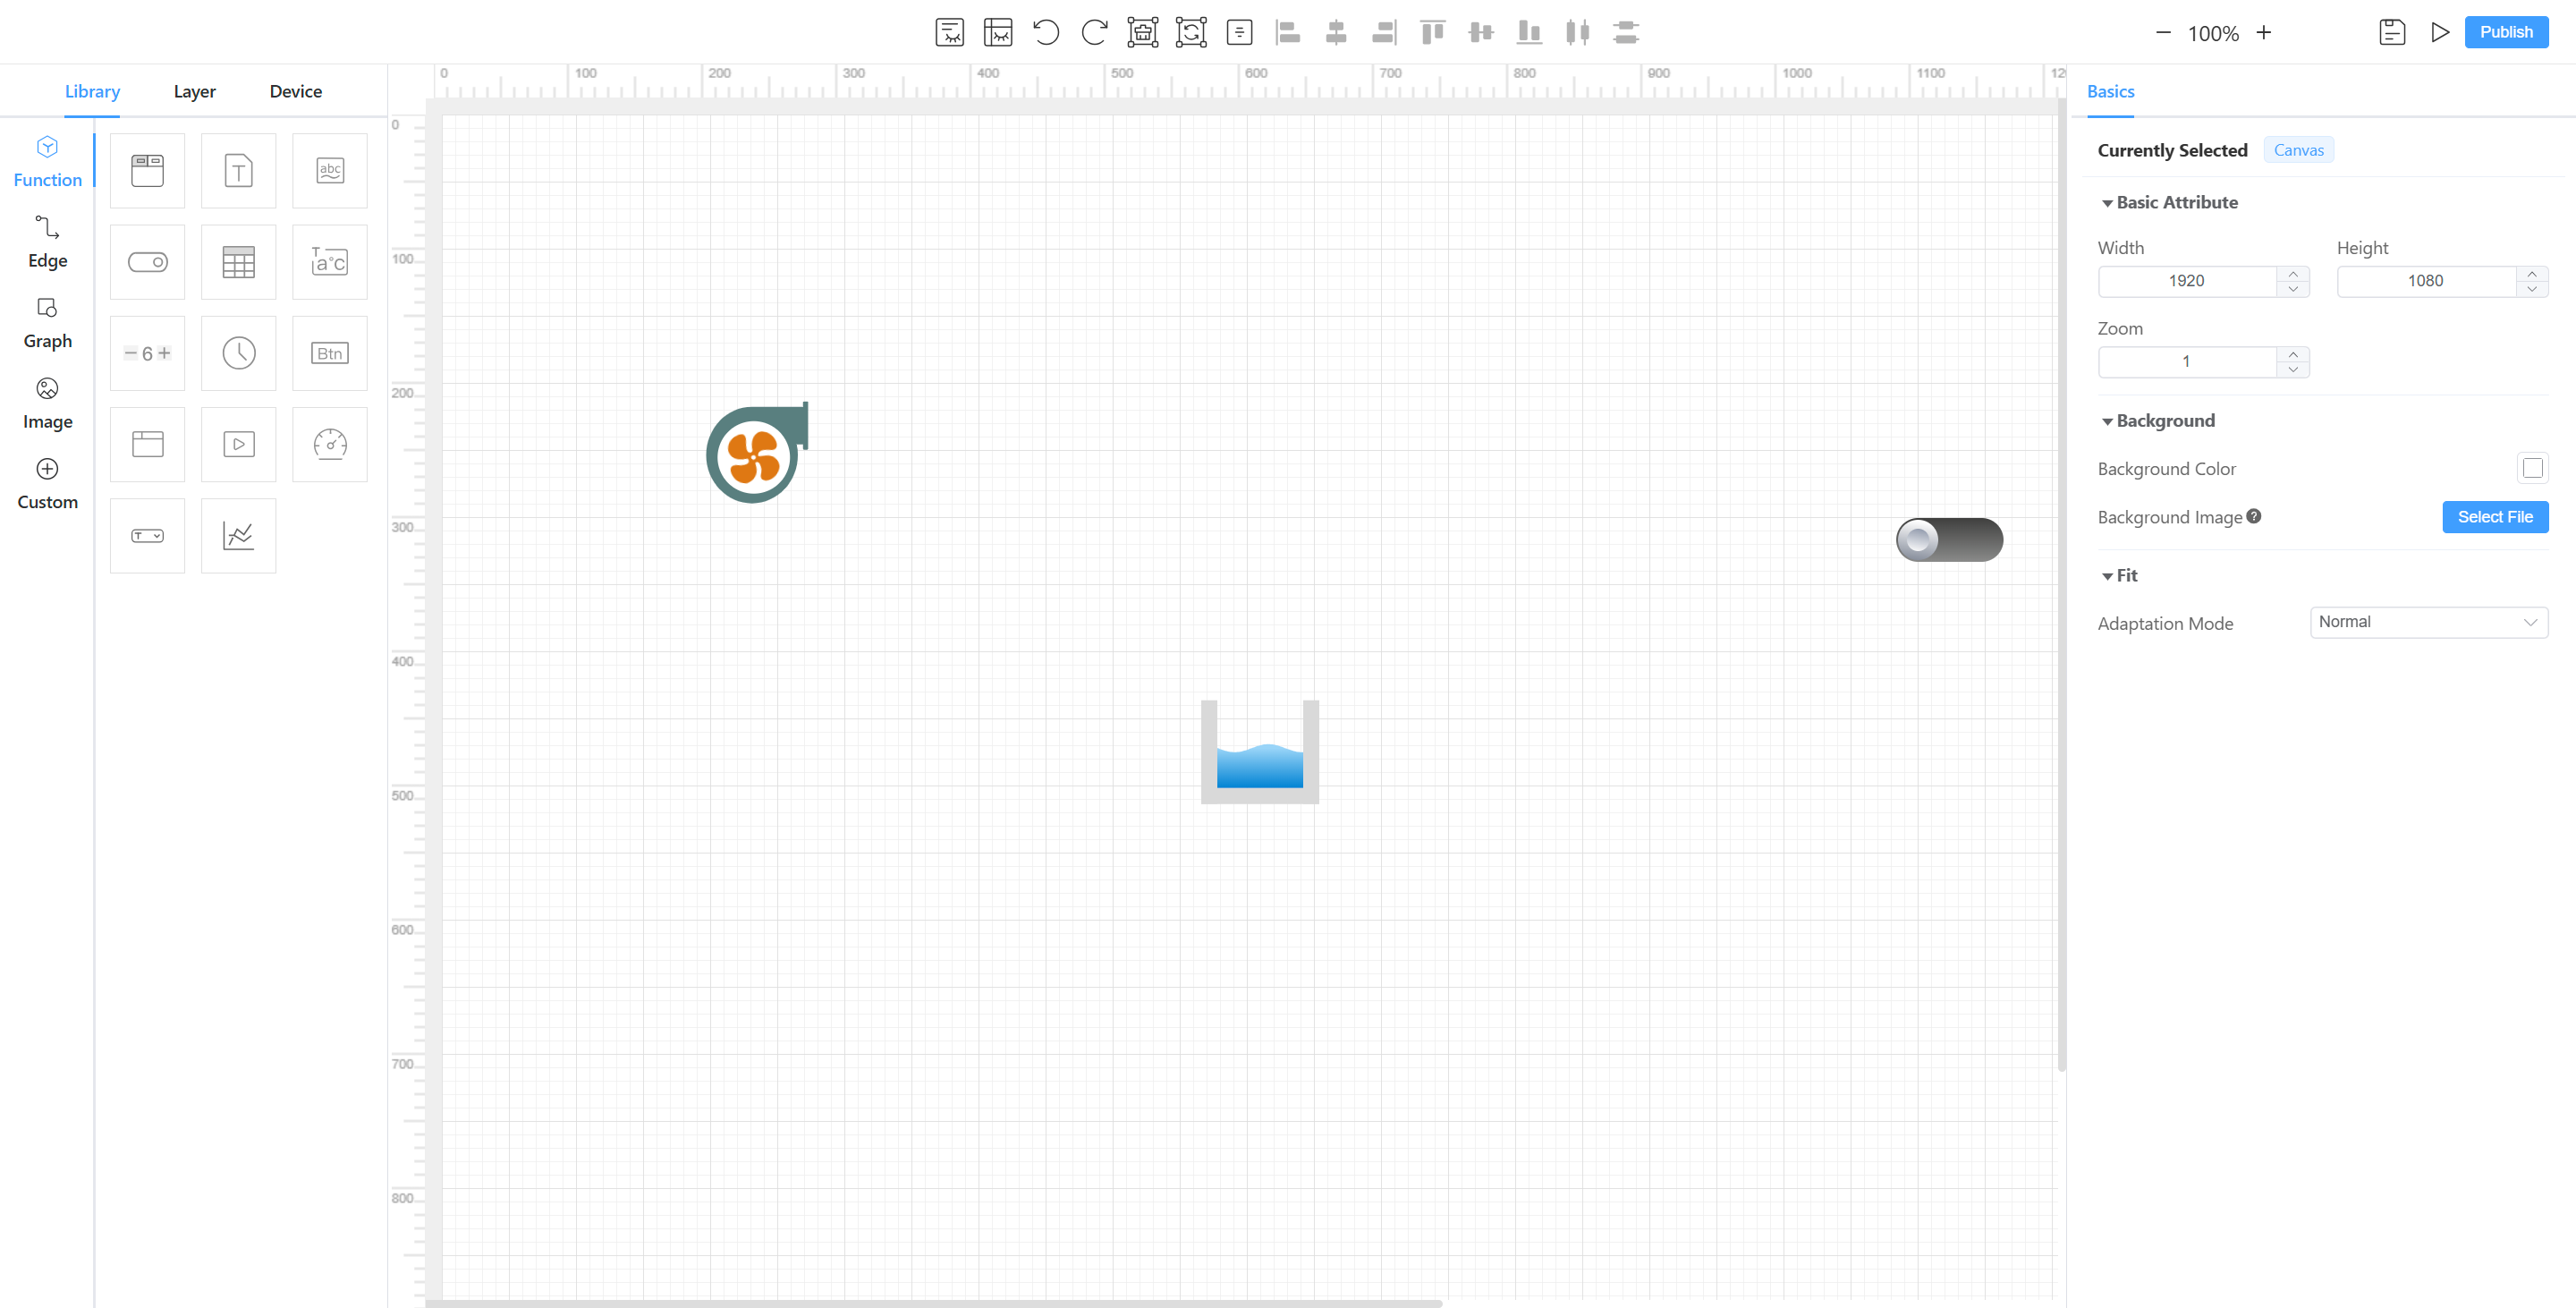
The selectable configuration elements of the left components include function, edge, graph, image, and custom. Function: Display different types of device data, such as static data which is usually used to identify graphics/images and some fixed fields, like a switch; dynamic data is usually used to display the dynamic model data of the device.
Edge: Represent physical relationships between devices or graphics, such as piping between cooling towers and pumps to represent water flow.
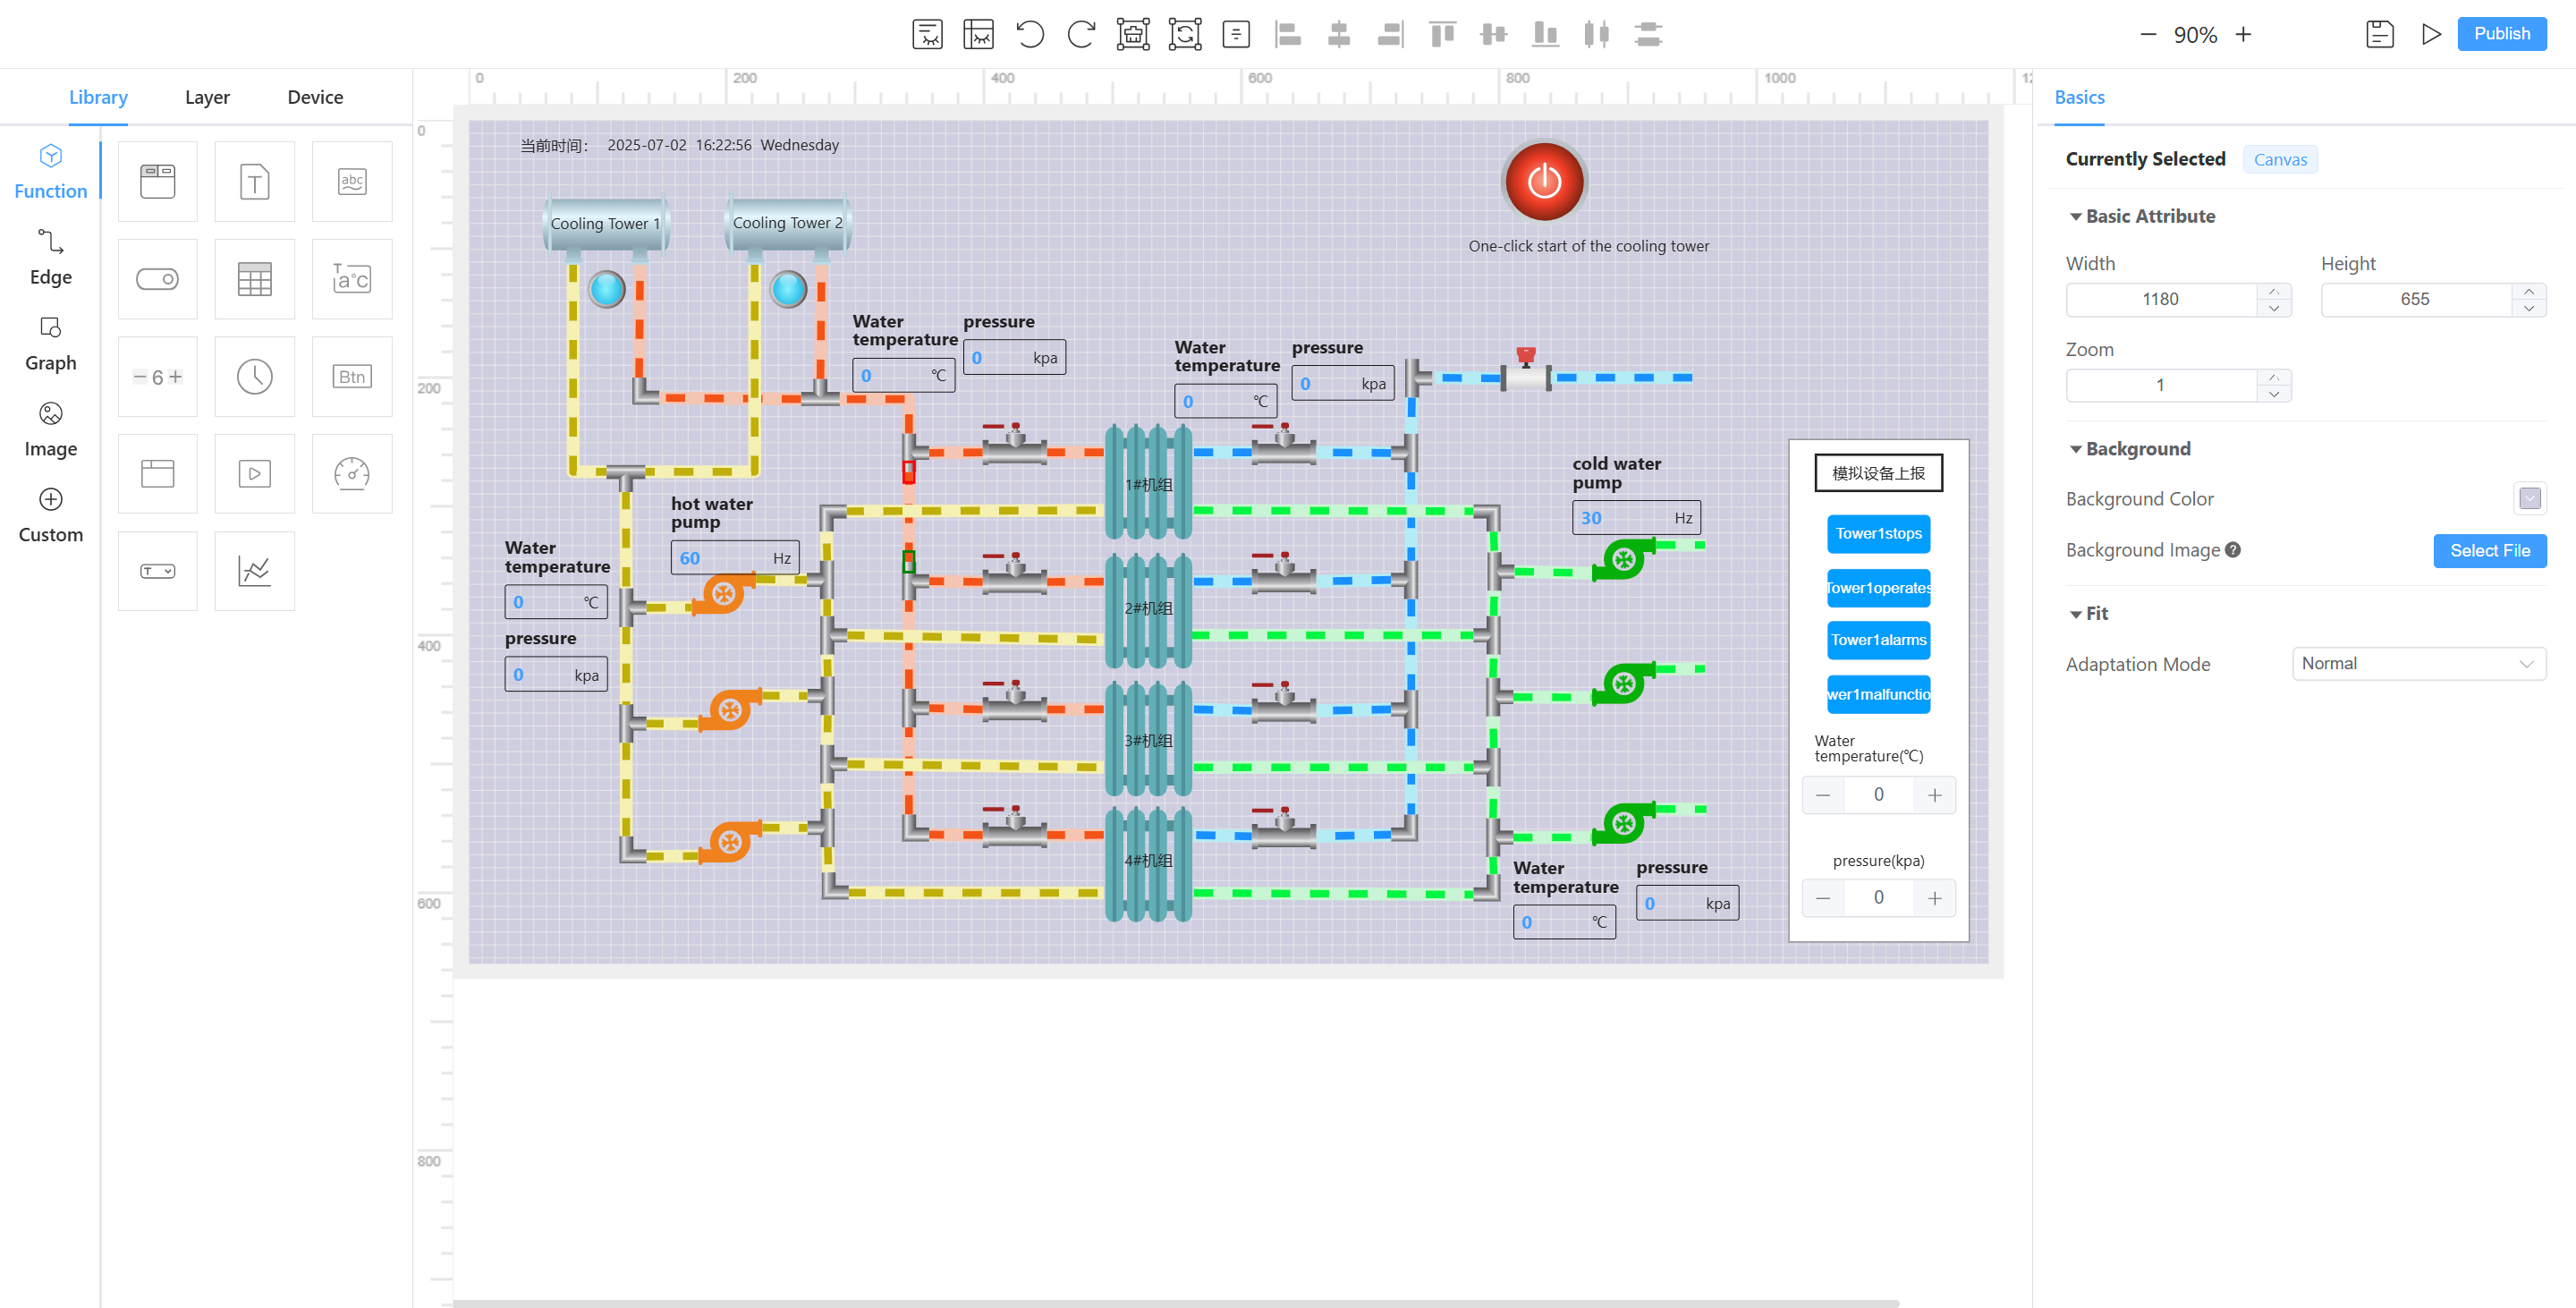
Graph: Pre-built realistic graphics for physical devices. These can reflect dynamic states (e.g., a pump graphic showing fill levels based on percentage data).
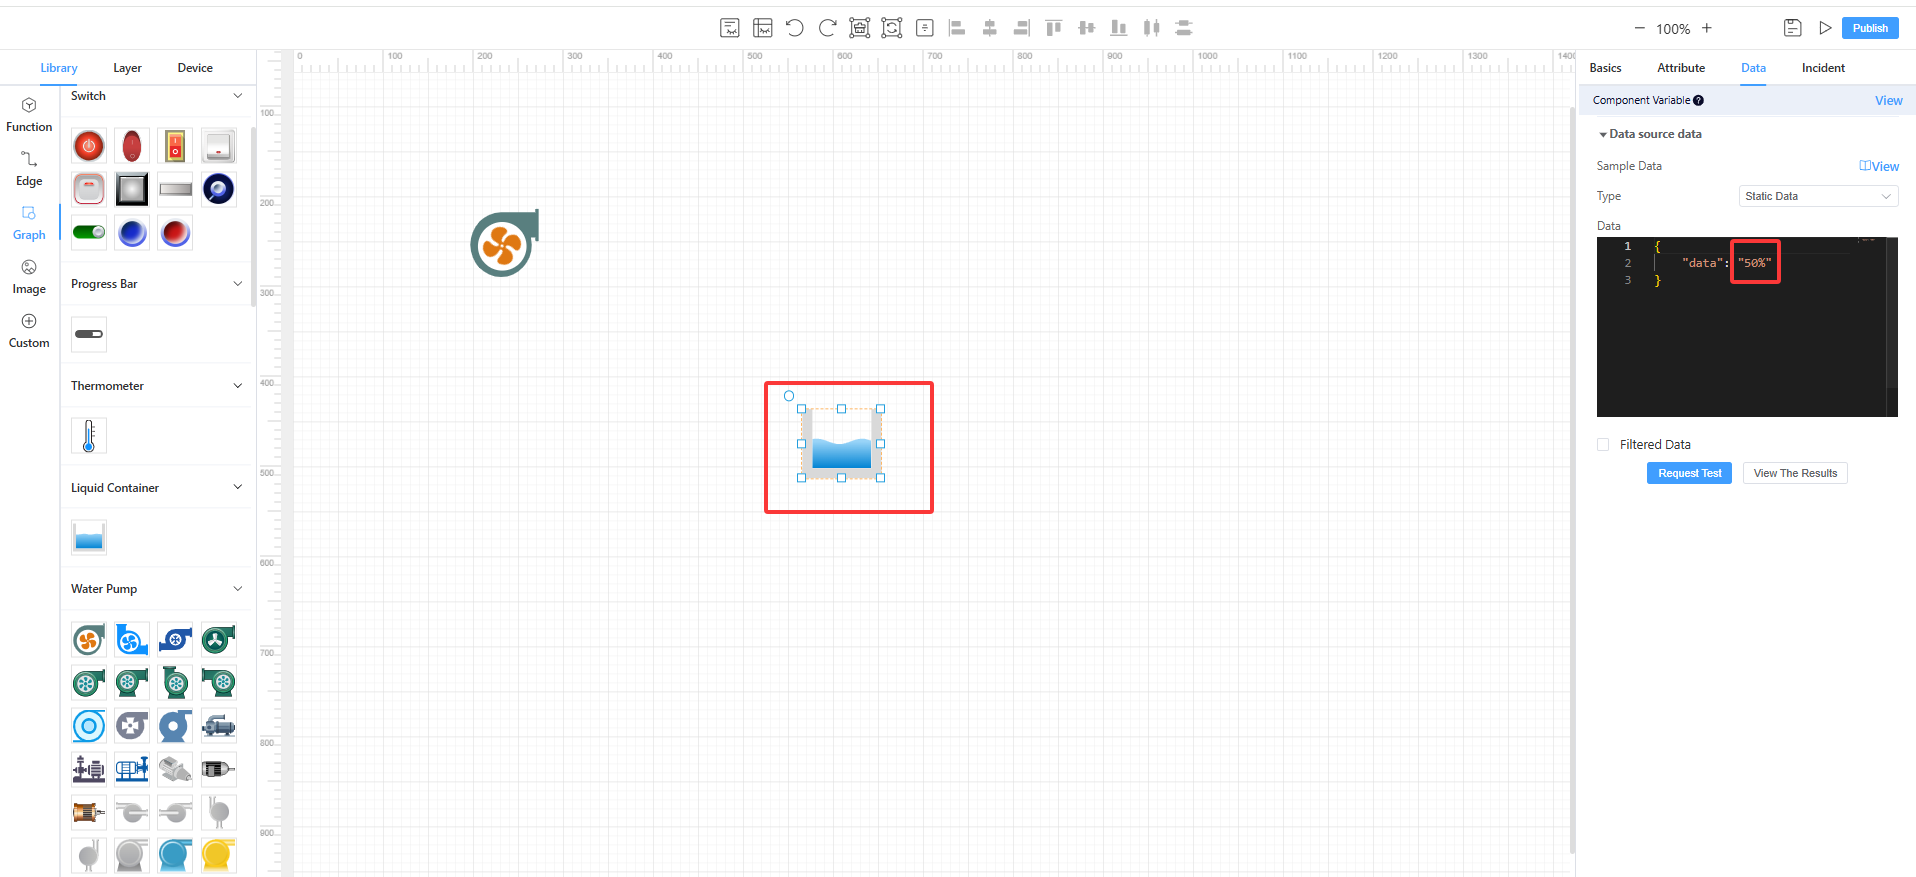
Image: Status indicator images that change with device states (e.g., green light for "on", red for "off"). Custom: Upload user-defined images when standard options are insufficient.
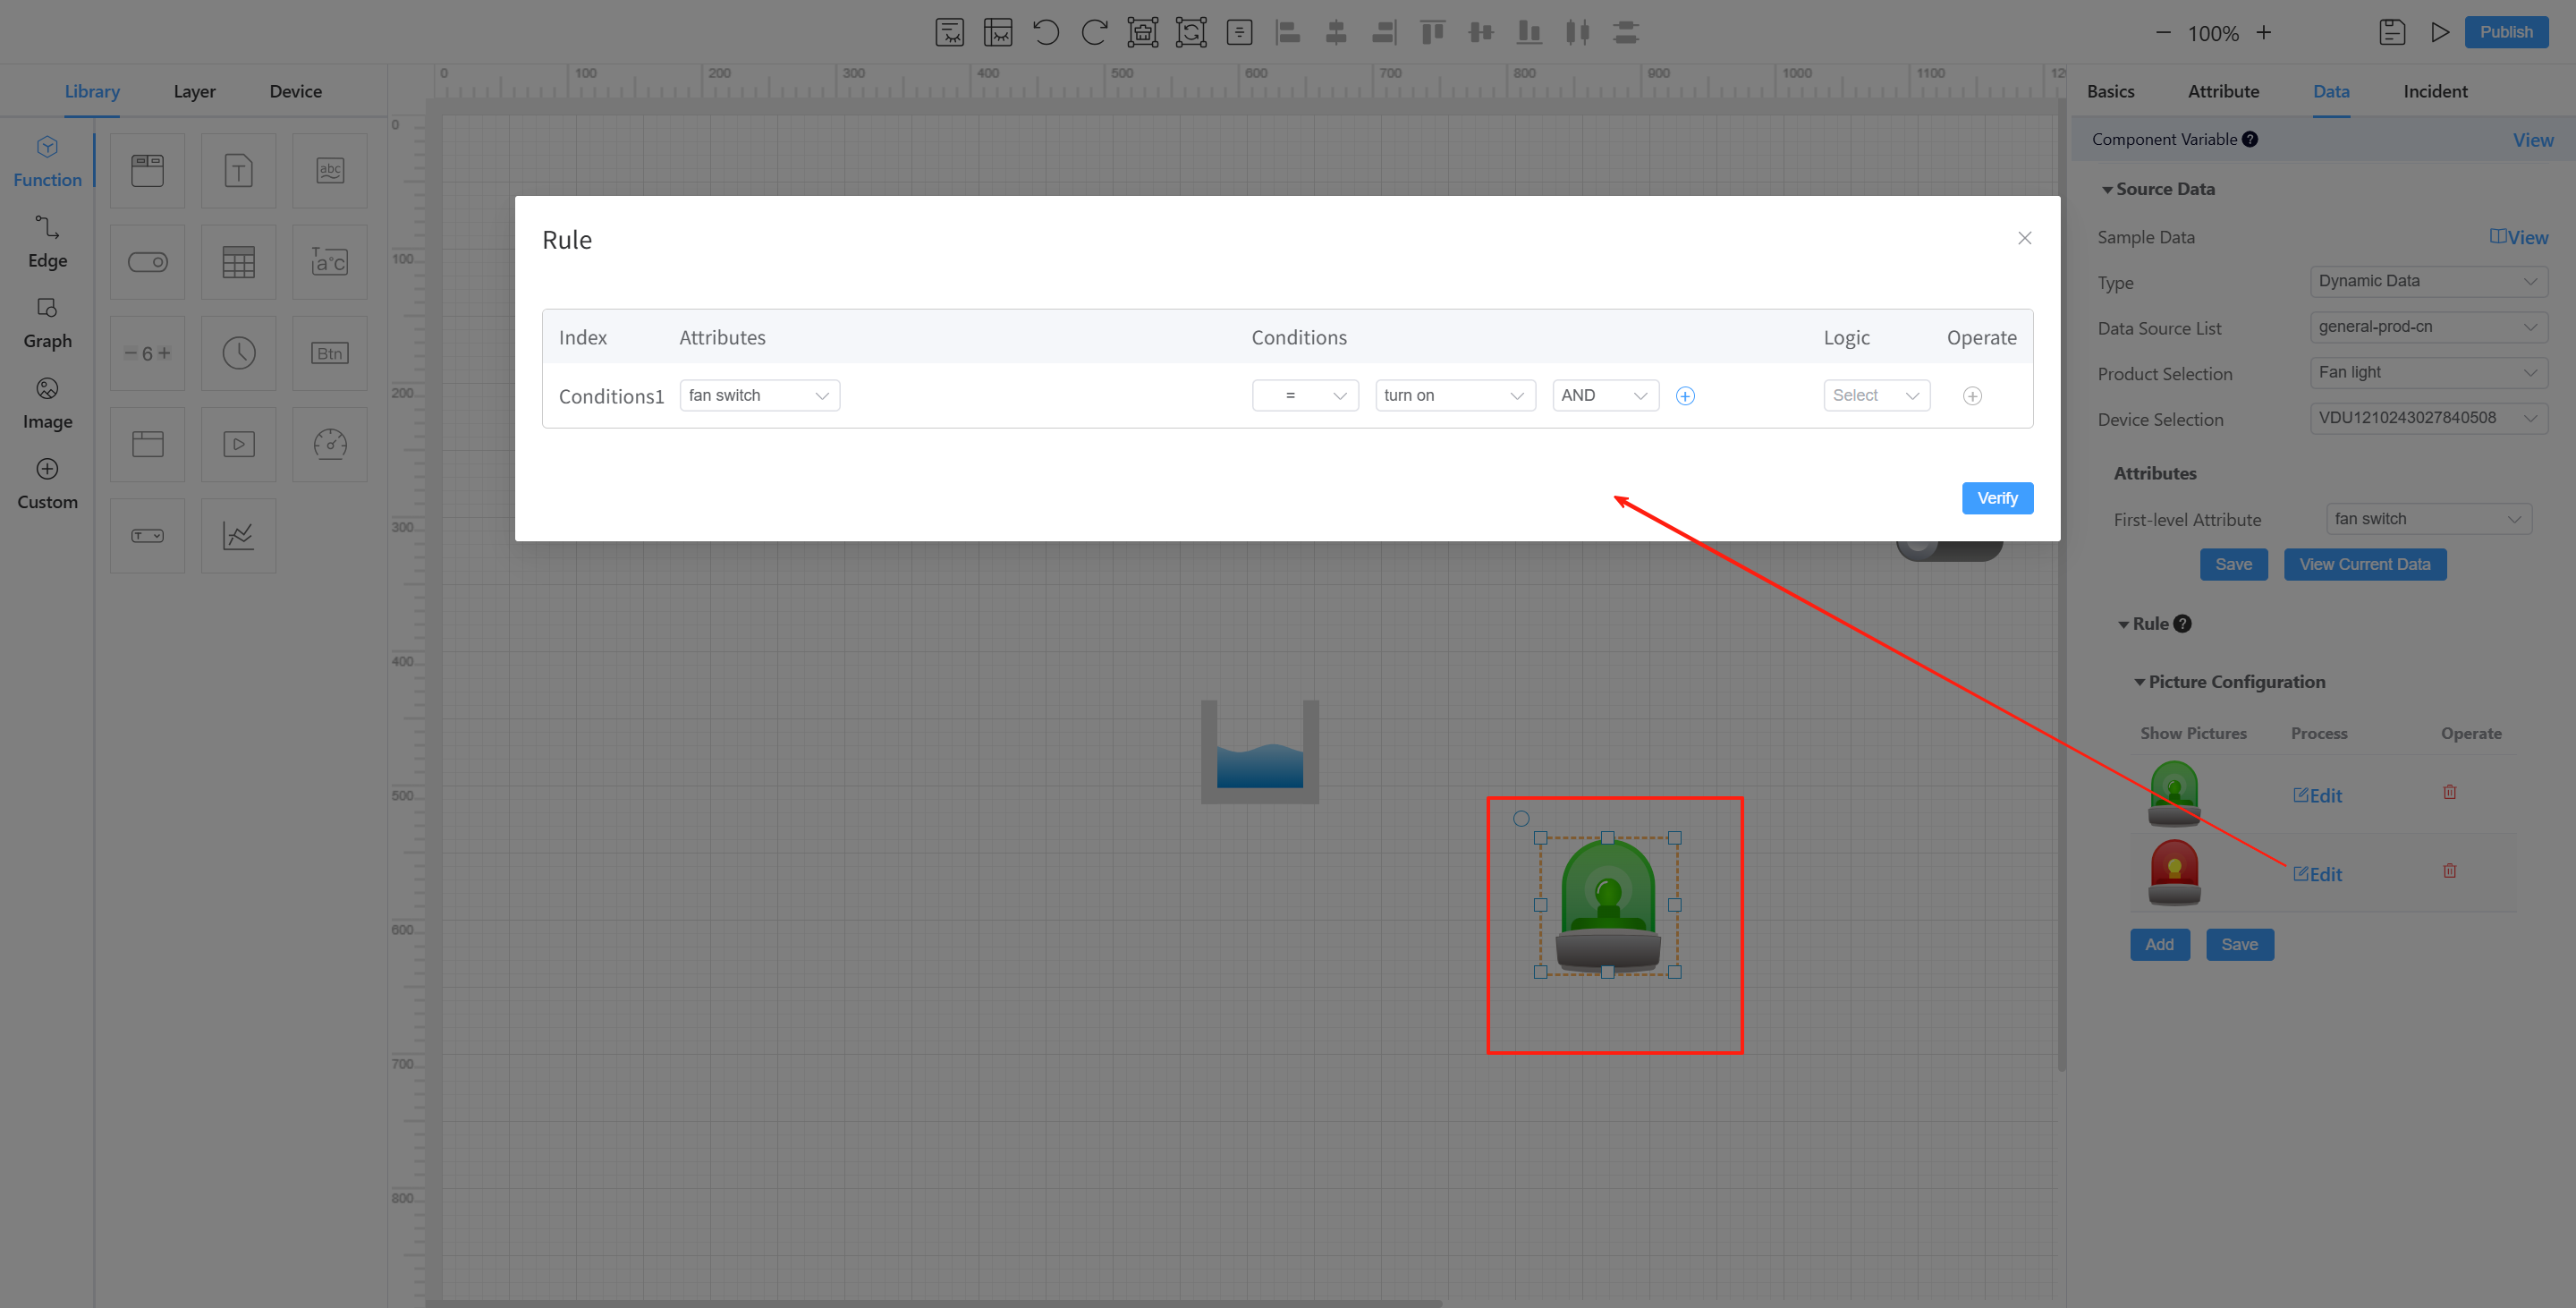
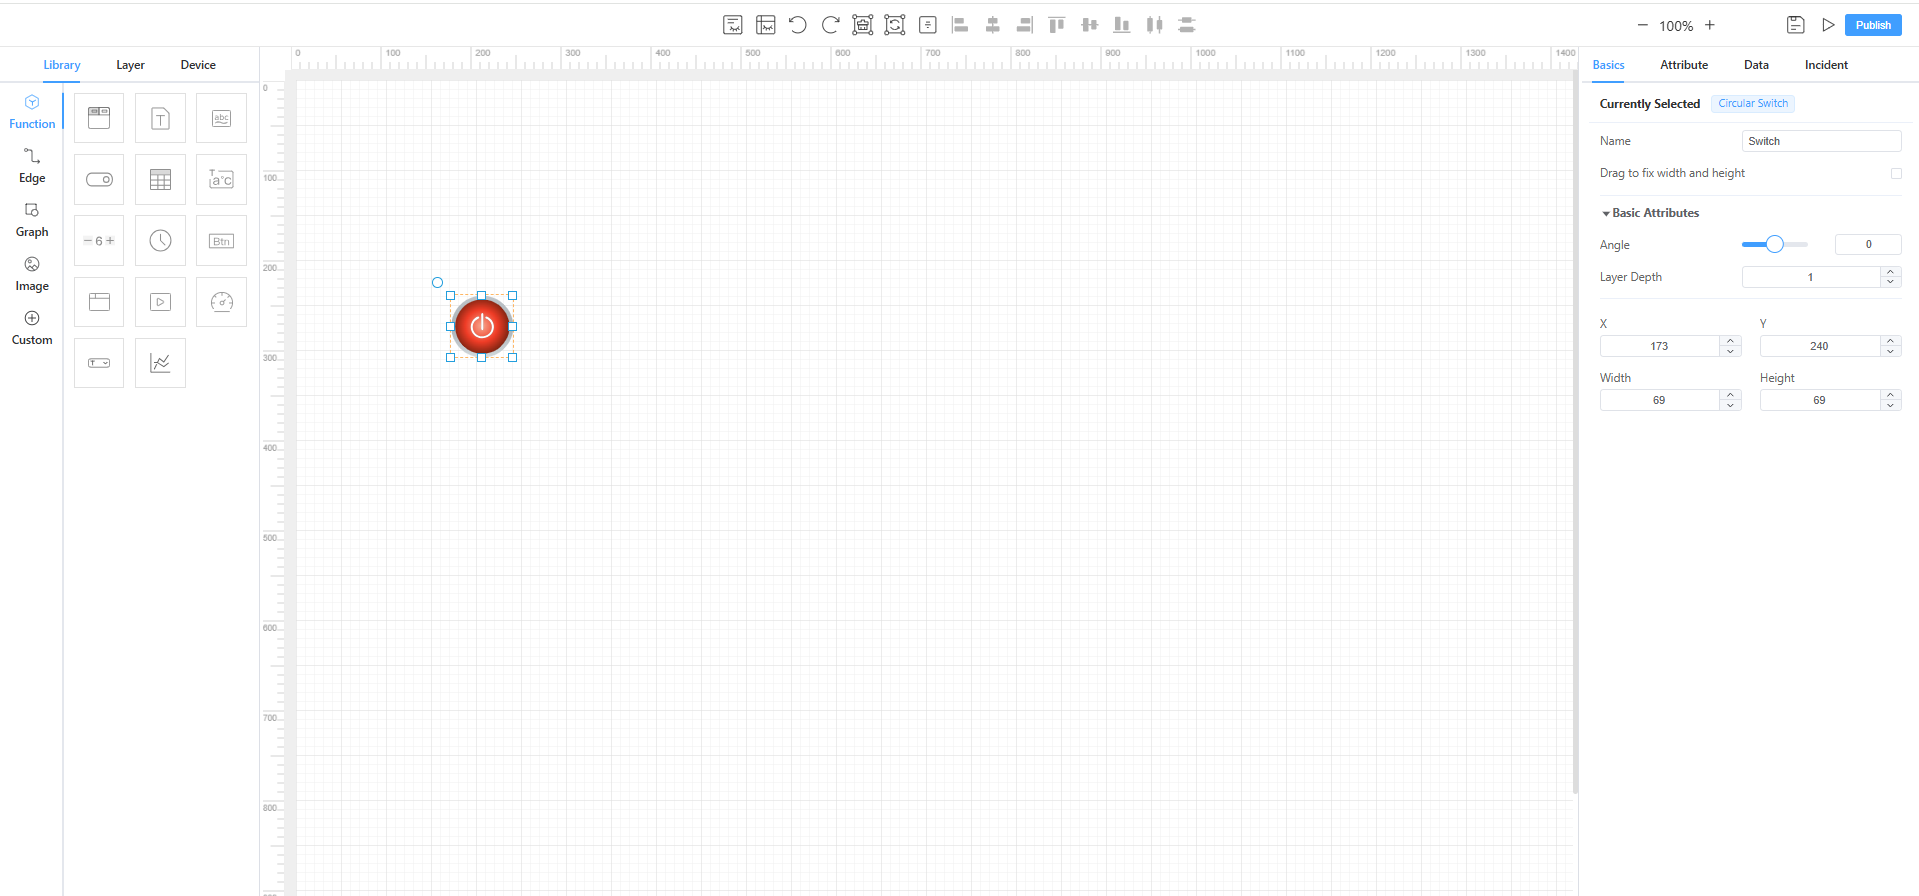
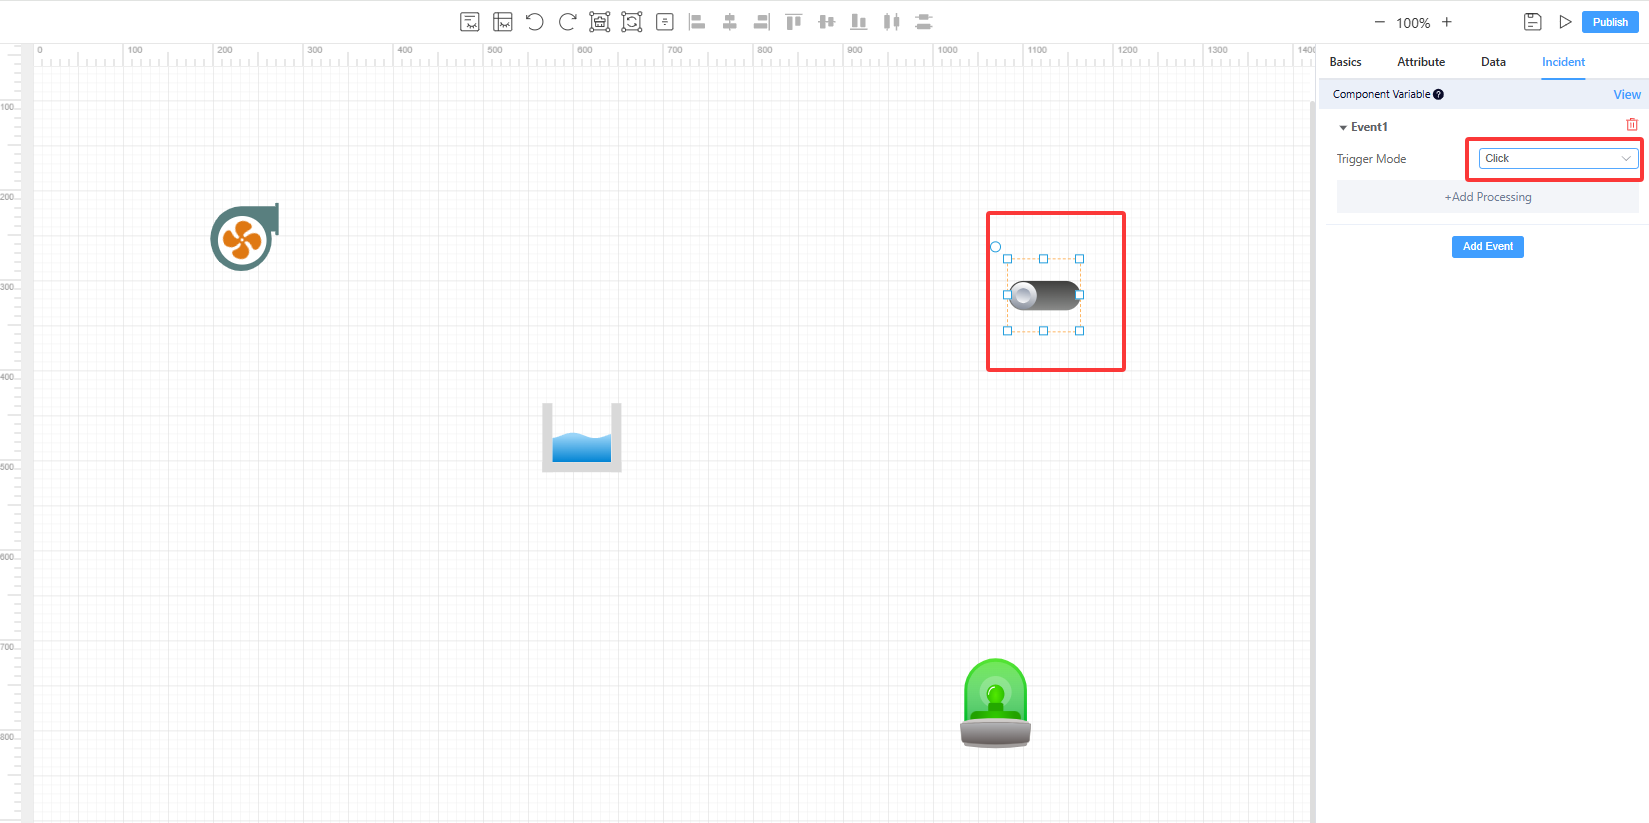
Right panel configuration options are as follows. -Basics: Configure the name, rotation, and position of the element. -Attribute: Configure the border, font, background, etc. of the element's appearance, including size and color. -Data: Configure the display of static data or dynamic data of the device. -Event: Configure the events that will be executed after the component is clicked or switched, such as triggering another component or sending a certain command to the device.
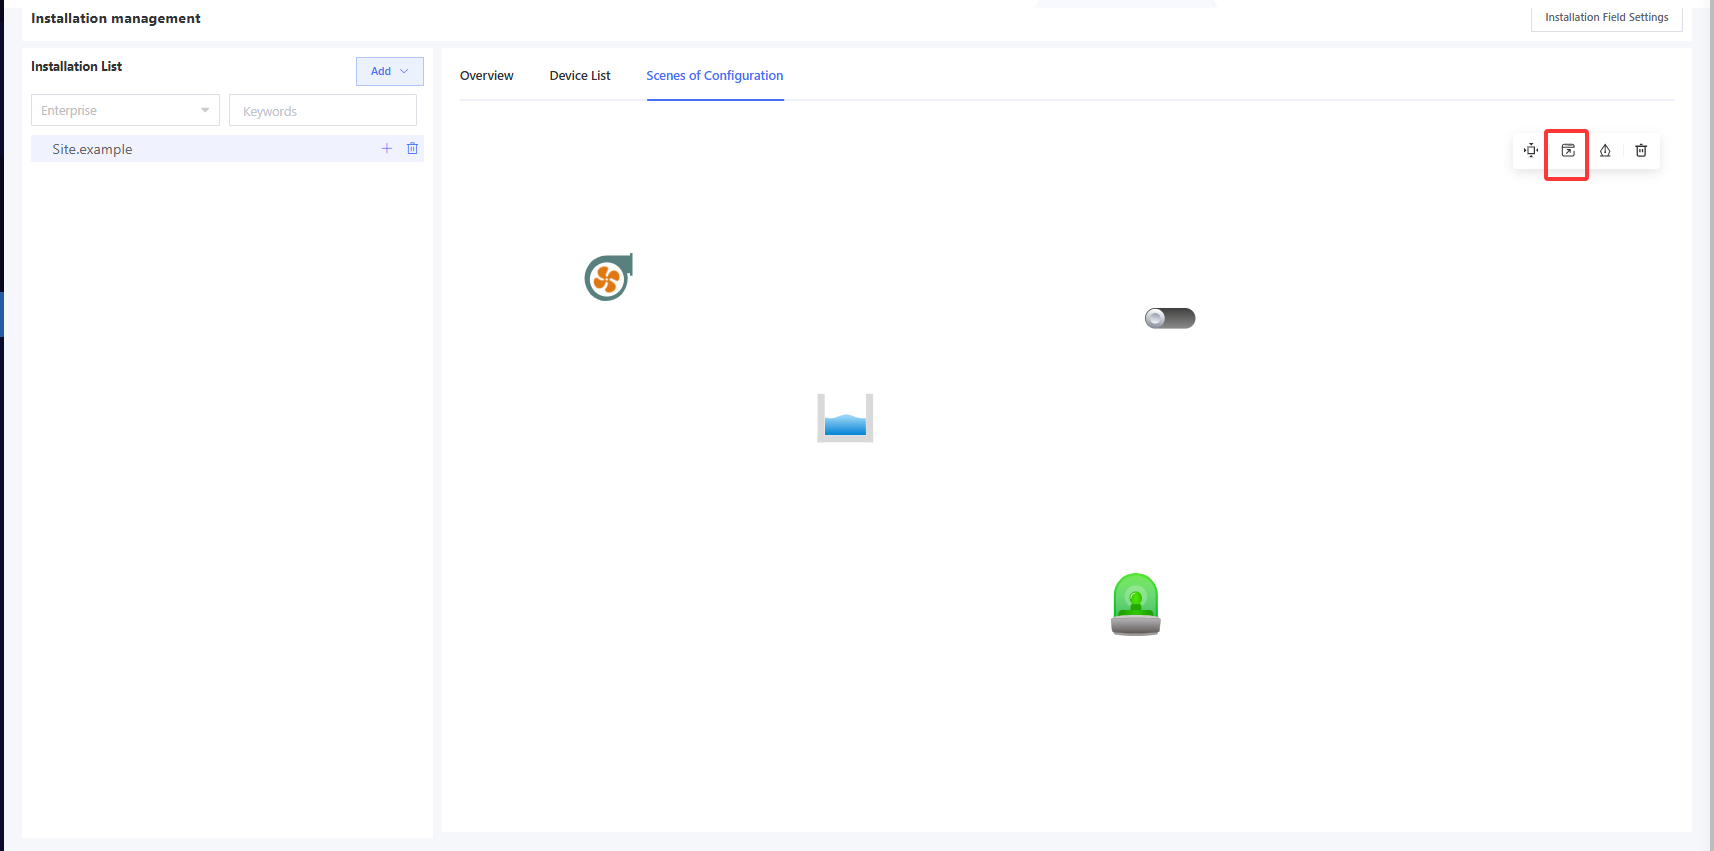
After completing the configuration, click “Publish” to display the configured view on the “Scenes of Configuration” page or open the configuration in “Full-screen Mode” for monitoring.